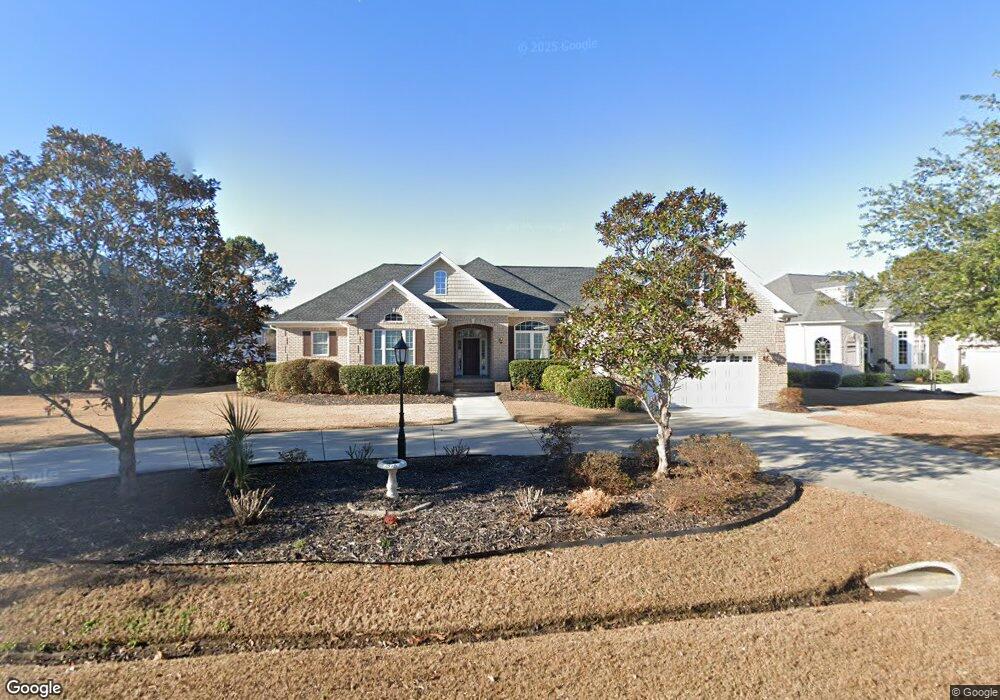
191 S Middleton Dr NW Unit Brunswick Plantation Calabash, NC 28467
Estimated Value: $537,000 - $626,000
4
Beds
4
Baths
3,500
Sq Ft
$166/Sq Ft
Est. Value
About This Home
This home is located at 191 S Middleton Dr NW Unit Brunswick Plantation, Calabash, NC 28467 and is currently estimated at $580,414, approximately $165 per square foot. 191 S Middleton Dr NW Unit Brunswick Plantation is a home located in Brunswick County with nearby schools including Jessie Mae Monroe Elementary School, Shallotte Middle School, and West Brunswick High School.
Ownership History
Date
Name
Owned For
Owner Type
Purchase Details
Closed on
Mar 28, 2024
Sold by
Goldsmith Douglas V and Goldsmith Therese M
Bought by
Lewis Allison Joy
Current Estimated Value
Purchase Details
Closed on
Jan 4, 2013
Sold by
Ruane Michael J and Ruane Bernice P
Bought by
Goldsmith Douglas and Goldsmith Therese M
Home Financials for this Owner
Home Financials are based on the most recent Mortgage that was taken out on this home.
Original Mortgage
$294,000
Interest Rate
3.35%
Mortgage Type
New Conventional
Purchase Details
Closed on
Feb 22, 2010
Sold by
Fox Carl E and Fox Saundra S
Bought by
Ruane Michael J and Ruane Bernice P
Home Financials for this Owner
Home Financials are based on the most recent Mortgage that was taken out on this home.
Original Mortgage
$215,000
Interest Rate
4.97%
Mortgage Type
New Conventional
Create a Home Valuation Report for This Property
The Home Valuation Report is an in-depth analysis detailing your home's value as well as a comparison with similar homes in the area
Home Values in the Area
Average Home Value in this Area
Purchase History
| Date | Buyer | Sale Price | Title Company |
|---|---|---|---|
| Lewis Allison Joy | -- | None Listed On Document | |
| Goldsmith Douglas | $367,000 | None Available | |
| Ruane Michael J | $353,000 | Residential Title & Escrow S |
Source: Public Records
Mortgage History
| Date | Status | Borrower | Loan Amount |
|---|---|---|---|
| Previous Owner | Goldsmith Douglas | $294,000 | |
| Previous Owner | Ruane Michael J | $215,000 |
Source: Public Records
Tax History Compared to Growth
Tax History
| Year | Tax Paid | Tax Assessment Tax Assessment Total Assessment is a certain percentage of the fair market value that is determined by local assessors to be the total taxable value of land and additions on the property. | Land | Improvement |
|---|---|---|---|---|
| 2025 | -- | $514,820 | $36,000 | $478,820 |
| 2024 | $2,161 | $514,820 | $36,000 | $478,820 |
| 2023 | $2,229 | $514,820 | $36,000 | $478,820 |
| 2022 | $0 | $377,090 | $45,000 | $332,090 |
| 2021 | $0 | $377,090 | $45,000 | $332,090 |
| 2020 | $2,081 | $377,090 | $45,000 | $332,090 |
| 2019 | $2,141 | $48,930 | $45,000 | $3,930 |
| 2018 | $2,131 | $69,710 | $65,000 | $4,710 |
| 2017 | $2,131 | $69,710 | $65,000 | $4,710 |
| 2016 | $2,081 | $69,710 | $65,000 | $4,710 |
| 2015 | $2,081 | $387,910 | $65,000 | $322,910 |
| 2014 | $1,811 | $364,099 | $100,000 | $264,099 |
Source: Public Records
Map
Nearby Homes
- 191 S Middleton Dr NW
- 186 Ravennaside Dr NW
- 485 S Middleton Dr NW
- 115 S Middleton Dr NW
- CUMBERLAND Plan at Brunswick Plantation
- CREPE MYRTLE Plan at Brunswick Plantation
- BELFORT Plan at Brunswick Plantation
- 8879 Habersham Place NW
- 154 Bernard Dr NW
- 8825 Wadsworth Dr
- 8845 Lansdowne Dr NW
- 1206 E Hayworth Lane Ave Unit Lot 1195- Kensington
- 330 S Middleton Dr NW Unit 1509
- 330 S Middleton Dr NW Unit 104
- 330 S Middleton Dr NW Unit 1208
- 330 S Middleton Dr NW Unit 1709
- 330 S Middleton Dr NW Unit 609
- 330 S Middleton Dr NW Unit 908
- 330 S Middleton Dr NW Unit 1009
- 330 S Middleton Dr NW Unit 1201
- 203 Middleton Lot77 I
- 203 S Middleton Dr NW
- 181 S Middleton Dr NW
- 211 S Middleton Dr NW
- 171 S Middleton Dr NW
- 196 S Middleton Dr NW
- 221 S Middleton Dr NW
- 204 S Middleton Dr NW
- 176 S Middleton Dr NW
- 163 S Middleton Dr NW
- 210 S Middleton Dr NW
- 233 S Middleton Dr NW
- 157 S Middleton Dr NW
- 218 S Middleton Dr NW
- 153 S Middleton Dr NW
- 154 S Middleton Dr NW
- 226 S Middleton Dr NW
- 245 S Middleton Dr NW
- 143 S Middleton Dr NW
- 106 Ravennaside Dr NW