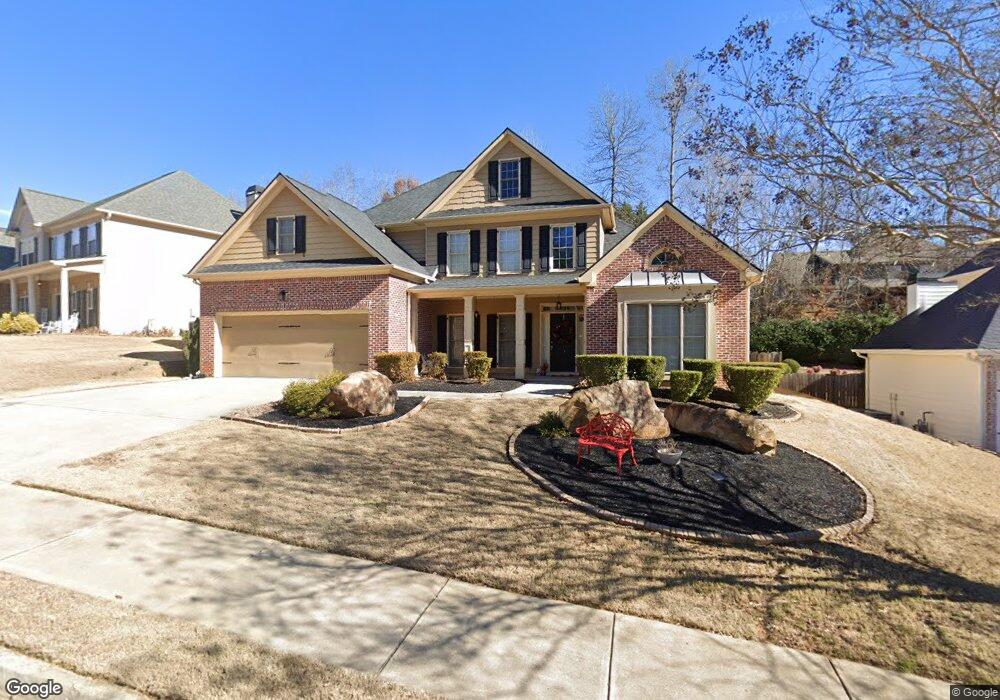
191 Thorn Creek Way Unit 63 Dallas, GA 30157
East Paulding County NeighborhoodEstimated Value: $462,684 - $527,000
5
Beds
3
Baths
2,739
Sq Ft
$181/Sq Ft
Est. Value
About This Home
This home is located at 191 Thorn Creek Way Unit 63, Dallas, GA 30157 and is currently estimated at $494,842, approximately $180 per square foot. 191 Thorn Creek Way Unit 63 is a home located in Paulding County with nearby schools including Mcgarity Elementary School, P. B. Ritch Middle School, and East Paulding High School.
Ownership History
Date
Name
Owned For
Owner Type
Purchase Details
Closed on
Oct 17, 2014
Sold by
Roper Steven Kyle
Bought by
Hannah Michael E
Current Estimated Value
Home Financials for this Owner
Home Financials are based on the most recent Mortgage that was taken out on this home.
Original Mortgage
$207,570
Outstanding Balance
$157,057
Interest Rate
3.75%
Mortgage Type
FHA
Estimated Equity
$337,785
Purchase Details
Closed on
Sep 5, 2008
Sold by
Suntrust Bk
Bought by
Roper Steven K and Roper Lyndsay A
Home Financials for this Owner
Home Financials are based on the most recent Mortgage that was taken out on this home.
Original Mortgage
$212,809
Interest Rate
6.36%
Mortgage Type
FHA
Purchase Details
Closed on
Feb 5, 2008
Sold by
Larry Bragg Homes Inc
Bought by
Community Trust Bank
Create a Home Valuation Report for This Property
The Home Valuation Report is an in-depth analysis detailing your home's value as well as a comparison with similar homes in the area
Home Values in the Area
Average Home Value in this Area
Purchase History
| Date | Buyer | Sale Price | Title Company |
|---|---|---|---|
| Hannah Michael E | $245,000 | -- | |
| Hannah Michael E | $245,000 | -- | |
| Roper Steven K | $216,200 | -- | |
| Community Trust Bank | $175,720 | -- |
Source: Public Records
Mortgage History
| Date | Status | Borrower | Loan Amount |
|---|---|---|---|
| Open | Hannah Michael E | $207,570 | |
| Closed | Hannah Michael E | $207,570 | |
| Previous Owner | Roper Steven K | $212,809 |
Source: Public Records
Tax History Compared to Growth
Tax History
| Year | Tax Paid | Tax Assessment Tax Assessment Total Assessment is a certain percentage of the fair market value that is determined by local assessors to be the total taxable value of land and additions on the property. | Land | Improvement |
|---|---|---|---|---|
| 2024 | $1,274 | $185,568 | $20,000 | $165,568 |
| 2023 | $1,505 | $186,952 | $20,000 | $166,952 |
| 2022 | $2,448 | $149,440 | $18,000 | $131,440 |
| 2021 | $2,303 | $123,848 | $18,000 | $105,848 |
| 2020 | $2,383 | $123,988 | $18,000 | $105,988 |
| 2019 | $2,155 | $110,560 | $18,000 | $92,560 |
| 2018 | $3,245 | $107,720 | $19,200 | $88,520 |
| 2017 | $2,802 | $91,720 | $19,200 | $72,520 |
| 2016 | $2,599 | $85,960 | $19,200 | $66,760 |
| 2015 | $2,653 | $86,200 | $19,200 | $67,000 |
| 2014 | $2,488 | $80,680 | $19,200 | $61,480 |
| 2013 | -- | $69,560 | $19,200 | $50,360 |
Source: Public Records
Map
Nearby Homes
- 346 Thorn Creek Way
- 2957 Charles Hardy Pkwy
- 355 Thorn Creek Way
- 110 Doris Path
- 29 Sedgefield Overlook
- 443 Creekwood Pass
- 150 Doris Path
- 107 Sedgefield Overlook
- 453 Thorn Creek Way
- 77 Hunters Green
- 468 Crestview Dr Unit 2
- 143 Hunters Creek
- 135 Powder Creek Dr
- 19 Dartmoor Cir
- 154 Hunters Trail
- 44 Easton Park Blvd
- 14 Cambridge Ln
- 42 Dartmoor Cir
- 88 Mount Vernon Dr
- 191 Thorn Creek Way
- 169 Thorn Creek Way
- 205 Thorn Creek Way
- 149 Thorn Creek Way
- 200 Sedgefield Dr
- 219 Thorn Creek Way
- 182 Sedgefield Dr
- 198 Thorn Creek Way
- 166 Thorn Creek Way
- 133 Thorn Creek Way
- 162 Sedgefield Dr
- 233 Thorn Creek Way
- 212 Thorn Creek Way
- 208 Sedgefield Dr
- 152 Thorn Creek Way
- 230 Thorn Creek Way
- 142 Sedgefield Dr
- 123 Thorn Creek Way
- 136 Thorn Creek Way Unit 153
- 136 Thorn Creek Way