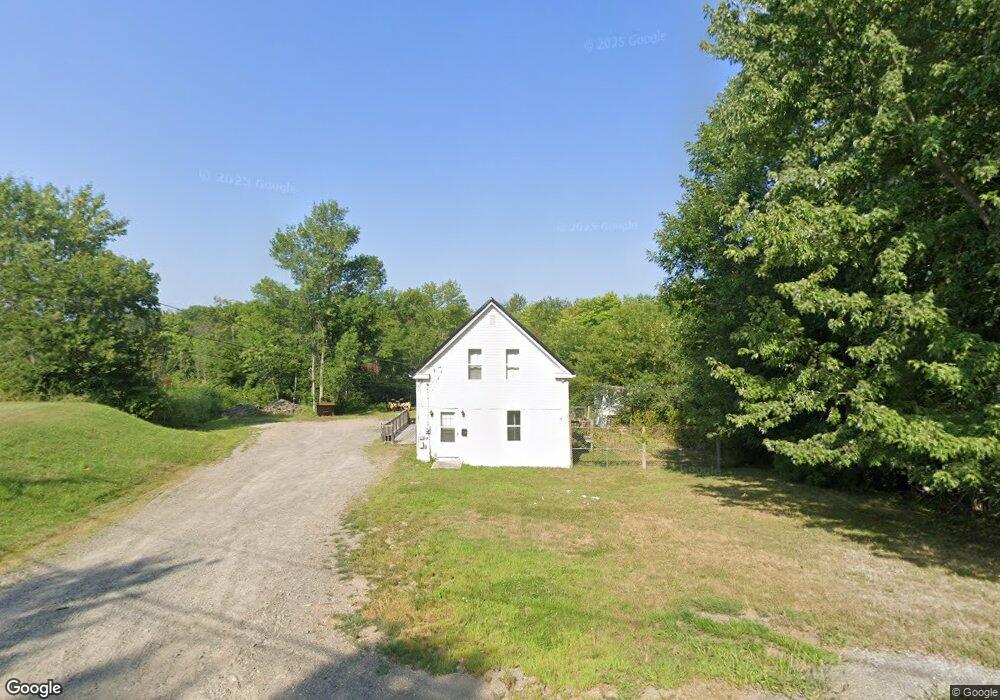
191 Union St Calais, ME 04619
Estimated Value: $97,000 - $147,000
3
Beds
1
Bath
525
Sq Ft
$212/Sq Ft
Est. Value
About This Home
This home is located at 191 Union St, Calais, ME 04619 and is currently estimated at $111,084, approximately $211 per square foot. 191 Union St is a home with nearby schools including Calais Elementary School and Calais Middle/High School.
Ownership History
Date
Name
Owned For
Owner Type
Purchase Details
Closed on
May 7, 2025
Sold by
Sivret Sherry
Bought by
Smith Creston H
Current Estimated Value
Home Financials for this Owner
Home Financials are based on the most recent Mortgage that was taken out on this home.
Original Mortgage
$97,000
Outstanding Balance
$96,482
Interest Rate
6.65%
Mortgage Type
Purchase Money Mortgage
Estimated Equity
$14,602
Purchase Details
Closed on
Sep 12, 2008
Sold by
Moholland Tina J
Bought by
Porter David E and Porter Teresa A
Create a Home Valuation Report for This Property
The Home Valuation Report is an in-depth analysis detailing your home's value as well as a comparison with similar homes in the area
Home Values in the Area
Average Home Value in this Area
Purchase History
| Date | Buyer | Sale Price | Title Company |
|---|---|---|---|
| Smith Creston H | $100,000 | None Available | |
| Smith Creston H | $100,000 | None Available | |
| Smith Creston H | $100,000 | None Available | |
| Porter David E | -- | -- | |
| Porter David E | -- | -- |
Source: Public Records
Mortgage History
| Date | Status | Borrower | Loan Amount |
|---|---|---|---|
| Open | Smith Creston H | $97,000 | |
| Closed | Smith Creston H | $97,000 |
Source: Public Records
Tax History Compared to Growth
Tax History
| Year | Tax Paid | Tax Assessment Tax Assessment Total Assessment is a certain percentage of the fair market value that is determined by local assessors to be the total taxable value of land and additions on the property. | Land | Improvement |
|---|---|---|---|---|
| 2024 | $1,197 | $79,800 | $15,600 | $64,200 |
| 2023 | $1,171 | $68,900 | $13,500 | $55,400 |
| 2022 | $1,056 | $55,600 | $10,900 | $44,700 |
| 2021 | $1,153 | $53,400 | $10,500 | $42,900 |
| 2020 | $1,154 | $45,600 | $8,900 | $36,700 |
| 2019 | $1,154 | $45,600 | $8,900 | $36,700 |
| 2018 | $1,154 | $45,600 | $8,900 | $36,700 |
| 2017 | $1,154 | $45,600 | $8,900 | $36,700 |
| 2016 | $1,009 | $39,900 | $8,900 | $31,000 |
| 2015 | $1,009 | $39,900 | $8,900 | $31,000 |
| 2014 | $1,009 | $39,900 | $8,900 | $31,000 |
| 2013 | $1,009 | $39,900 | $8,900 | $31,000 |
Source: Public Records
Map
Nearby Homes