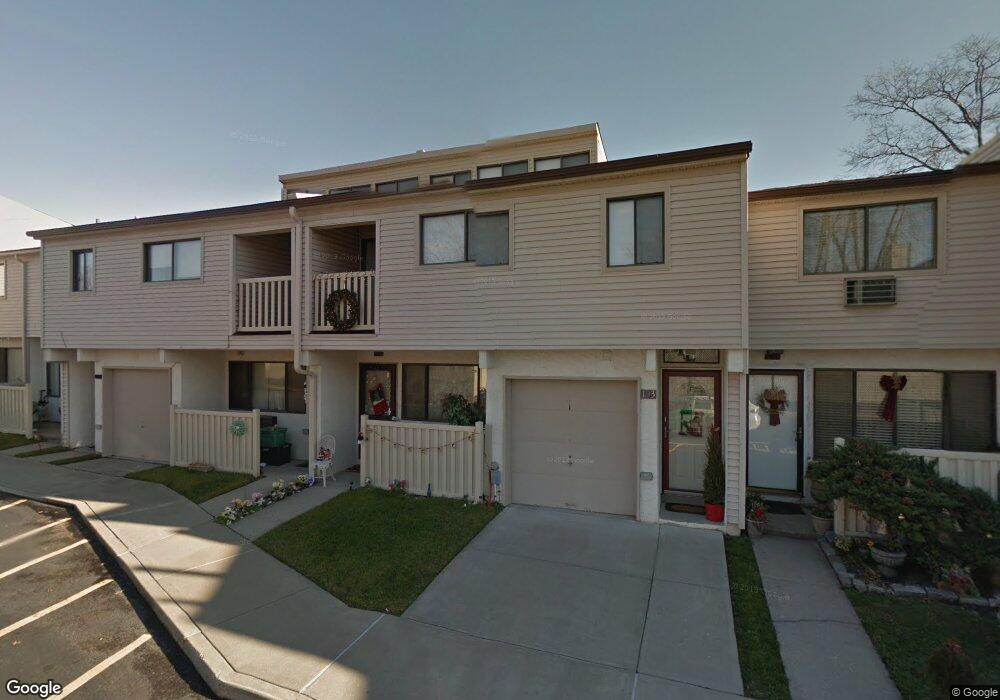
191 Winding Woods Loop Unit 77 Staten Island, NY 10307
Tottenville NeighborhoodEstimated Value: $251,034 - $313,000
--
Bed
1
Bath
600
Sq Ft
$477/Sq Ft
Est. Value
About This Home
This home is located at 191 Winding Woods Loop Unit 77, Staten Island, NY 10307 and is currently estimated at $286,259, approximately $477 per square foot. 191 Winding Woods Loop Unit 77 is a home located in Richmond County with nearby schools including P.S. 6 Cpl Allan F Kivlehan School, Is 34 Tottenville, and Tottenville High School.
Ownership History
Date
Name
Owned For
Owner Type
Purchase Details
Closed on
Jan 30, 2007
Sold by
Ennis Maureen E and Mooney Dennis M
Bought by
Virani Roshanali and Virani Mumtaz
Current Estimated Value
Home Financials for this Owner
Home Financials are based on the most recent Mortgage that was taken out on this home.
Original Mortgage
$100,000
Outstanding Balance
$60,261
Interest Rate
6.27%
Mortgage Type
Purchase Money Mortgage
Estimated Equity
$225,998
Purchase Details
Closed on
Jul 16, 2004
Sold by
Doherty John J and Doherty Janet
Bought by
Ennis Maureen E and Mooney Dennis M
Home Financials for this Owner
Home Financials are based on the most recent Mortgage that was taken out on this home.
Original Mortgage
$110,570
Interest Rate
9.87%
Mortgage Type
Purchase Money Mortgage
Create a Home Valuation Report for This Property
The Home Valuation Report is an in-depth analysis detailing your home's value as well as a comparison with similar homes in the area
Home Values in the Area
Average Home Value in this Area
Purchase History
| Date | Buyer | Sale Price | Title Company |
|---|---|---|---|
| Virani Roshanali | $125,000 | None Available | |
| Ennis Maureen E | $116,390 | Newell & Talarico Title |
Source: Public Records
Mortgage History
| Date | Status | Borrower | Loan Amount |
|---|---|---|---|
| Open | Virani Roshanali | $100,000 | |
| Previous Owner | Ennis Maureen E | $110,570 |
Source: Public Records
Tax History Compared to Growth
Tax History
| Year | Tax Paid | Tax Assessment Tax Assessment Total Assessment is a certain percentage of the fair market value that is determined by local assessors to be the total taxable value of land and additions on the property. | Land | Improvement |
|---|---|---|---|---|
| 2025 | $2,606 | $18,316 | $1,216 | $17,100 |
| 2024 | $2,606 | $18,497 | $1,204 | $17,293 |
| 2023 | $2,615 | $12,877 | $1,120 | $11,757 |
| 2022 | $2,425 | $17,525 | $1,716 | $15,809 |
| 2021 | $2,412 | $15,329 | $1,716 | $13,613 |
| 2020 | $2,289 | $14,789 | $1,716 | $13,073 |
| 2019 | $2,262 | $13,786 | $1,716 | $12,070 |
| 2018 | $2,187 | $10,731 | $1,431 | $9,300 |
| 2017 | $2,064 | $10,124 | $1,468 | $8,656 |
| 2016 | $1,909 | $9,551 | $1,417 | $8,134 |
| 2015 | $1,783 | $9,011 | $1,716 | $7,295 |
| 2014 | $1,783 | $9,292 | $1,716 | $7,576 |
Source: Public Records
Map
Nearby Homes
- 110 Surfside Plaza Unit 88
- 108 Surfside Plaza Unit 87
- 320 Sprague Ave
- 327 Sprague Ave
- 659 Rockaway St Unit 661
- 660 Rockaway St
- 61 Billop Ave
- 539 Yetman Ave
- 57 Sunset Ln
- 667 Yetman Ave
- 382 Manhattan St
- 443 Manhattan St
- 220 Sprague Ave
- 342 Chelsea St
- 284 Chelsea St
- 329 George St
- 411 Yetman Ave
- 36 Adlers Ln
- 403 Yetman Ave
- 43 Ottavio Promenade
- 193 Winding Woods Loop Unit 78
- 189 Windingwood Loop
- 185 Winding Woods Loop Unit 74
- 112 Surfside Plaza Unit 7860-7502
- 112 Surfside Plaza Unit 89
- 104 Surfside Plaza Unit 85
- 203 Winding Woods Loop Unit 80
- 114 Surfside Plaza Unit 90
- 102 Surfside Plaza Unit 84
- 201 Winding Woods Loop Unit 81
- 183 Winding Woods Loop Unit 73
- 116 Surfside Plaza Unit 91
- 181 Winding Woods Loop Unit 72
- 118 Surfside Plaza Unit 92
- 122 Surfside Plaza Unit 94
- 106 Surfside Plaza Unit 86
- 205 Winding Woods Loop Unit 83
- 195 Winding Woods Loop Unit 79
- 189 Winding Woods Loop Unit 76
- 187 Winding Woods Loop Unit 75