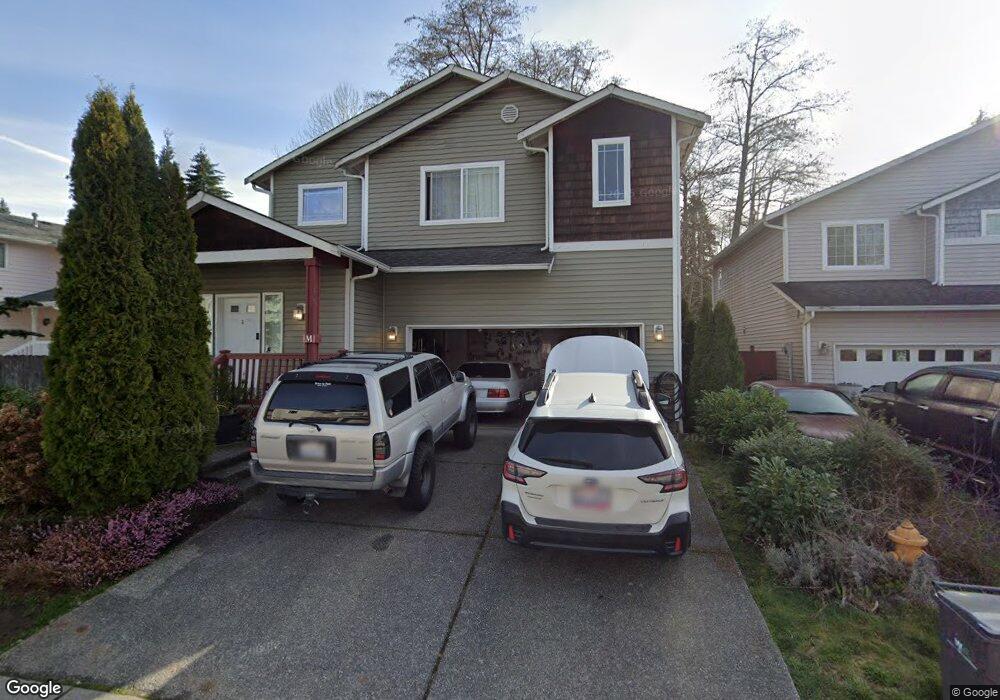
1910 112th St SW Unit 11 Everett, WA 98204
Holly NeighborhoodEstimated Value: $640,000 - $709,000
4
Beds
3
Baths
1,838
Sq Ft
$361/Sq Ft
Est. Value
About This Home
This home is located at 1910 112th St SW Unit 11, Everett, WA 98204 and is currently estimated at $663,007, approximately $360 per square foot. 1910 112th St SW Unit 11 is a home located in Snohomish County with nearby schools including Fairmount Elementary School, Explorer Middle School, and Mariner High School.
Ownership History
Date
Name
Owned For
Owner Type
Purchase Details
Closed on
Mar 19, 2011
Sold by
Tran Kevin
Bought by
Tran Truc
Current Estimated Value
Purchase Details
Closed on
Sep 27, 2010
Sold by
Federal Deposit Insurance Corporation
Bought by
Tran Kevin
Purchase Details
Closed on
May 30, 2009
Sold by
Cancel David and Cancel Genevie R
Bought by
Amtrust Bank
Purchase Details
Closed on
Nov 8, 2005
Sold by
Dynasty Homes Inc
Bought by
Cancel David and Cancel Genevie R
Home Financials for this Owner
Home Financials are based on the most recent Mortgage that was taken out on this home.
Original Mortgage
$261,320
Interest Rate
5.75%
Mortgage Type
Fannie Mae Freddie Mac
Create a Home Valuation Report for This Property
The Home Valuation Report is an in-depth analysis detailing your home's value as well as a comparison with similar homes in the area
Home Values in the Area
Average Home Value in this Area
Purchase History
| Date | Buyer | Sale Price | Title Company |
|---|---|---|---|
| Tran Truc | -- | None Available | |
| Tran Kevin | $200,000 | None Available | |
| Amtrust Bank | $228,000 | First American | |
| Cancel David | $326,650 | Pnwt |
Source: Public Records
Mortgage History
| Date | Status | Borrower | Loan Amount |
|---|---|---|---|
| Previous Owner | Cancel David | $261,320 |
Source: Public Records
Tax History Compared to Growth
Tax History
| Year | Tax Paid | Tax Assessment Tax Assessment Total Assessment is a certain percentage of the fair market value that is determined by local assessors to be the total taxable value of land and additions on the property. | Land | Improvement |
|---|---|---|---|---|
| 2025 | $4,466 | $596,200 | $335,000 | $261,200 |
| 2024 | $4,466 | $576,200 | $315,000 | $261,200 |
| 2023 | $4,654 | $615,900 | $291,000 | $324,900 |
| 2022 | $4,141 | $474,800 | $199,000 | $275,800 |
| 2020 | $3,667 | $422,500 | $189,000 | $233,500 |
| 2019 | $3,336 | $389,200 | $158,000 | $231,200 |
| 2018 | $3,407 | $342,300 | $136,000 | $206,300 |
| 2017 | $2,917 | $299,800 | $119,000 | $180,800 |
| 2016 | $2,688 | $260,200 | $87,000 | $173,200 |
| 2015 | $2,688 | $247,200 | $79,000 | $168,200 |
| 2013 | -- | $190,200 | $52,000 | $138,200 |
Source: Public Records
Map
Nearby Homes
- 2006 112th St SW
- 1807 112th St SW
- 11104 Paine Field Way
- 10000 23rd Ave W
- 11527 Highway 99 Unit B303
- 11527 Highway 99 Unit C102
- 11517 Marino Ave Unit B
- 2101 Center Rd
- 1520 Hollow Dale Place Unit B
- 11527 Hwy 99 Unit C106
- 1518 Hollow Dale Place Unit A
- 1518 Hollow Dale Place Unit D
- The Cascade Plan at Hollowdale
- The Alpine Plan at Hollowdale
- The Olympic Plan at Hollowdale
- 14000 Center Rd
- 24 XX Center Rd
- 10724 21st Place W Unit A
- 2312 117th Place SW
- 11626 Admiralty Way Unit A
- 1910 112th St SW Unit G
- 1910 112th St SW Unit D
- 1910 112th St SW Unit J
- 1910 112th St SW Unit 13
- 1910 112th St SW Unit 12
- 1910 112th St SW Unit 10
- 1910 112th St SW Unit 9
- 1910 112th St SW Unit 8
- 1910 112th St SW Unit 7
- 1910 112th St SW Unit 6
- 1910 112th St SW Unit 5
- 1910 112th St SW Unit 4
- 1910 112th St SW Unit 3
- 1910 112th St SW Unit 2
- 1910 112th St SW Unit 1
- 1910 112th St SW Unit A
- 1910 112th St SW Unit M
- 1910 112th St SW
- 1910 112th St SW Unit I