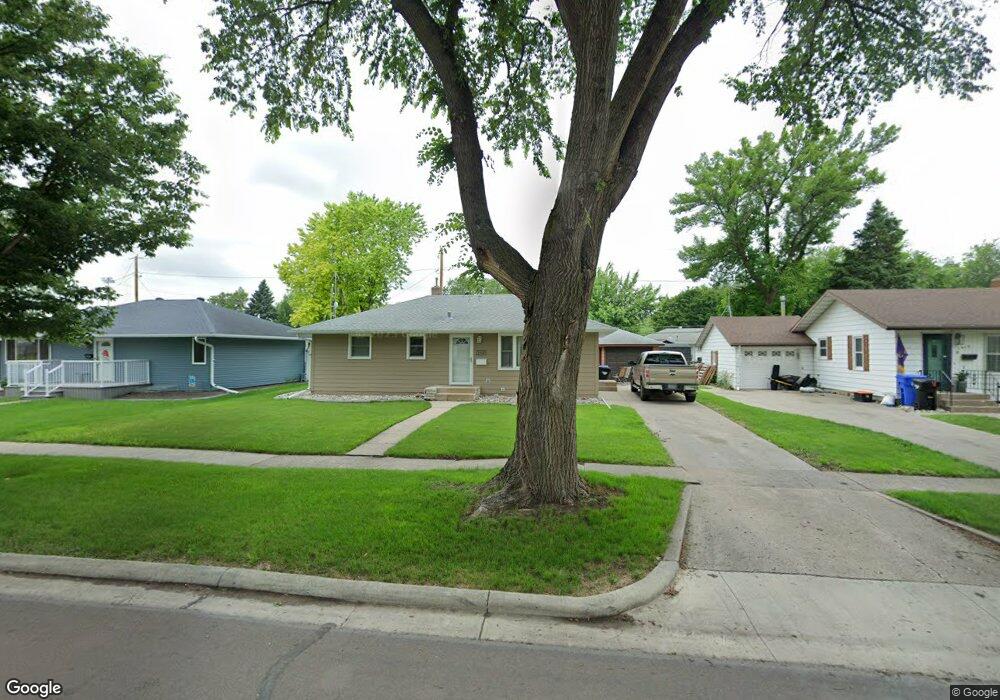
1910 9th St N Fargo, ND 58102
Northport NeighborhoodEstimated Value: $197,603 - $272,000
Studio
--
Bath
1,040
Sq Ft
$225/Sq Ft
Est. Value
About This Home
This home is located at 1910 9th St N, Fargo, ND 58102 and is currently estimated at $233,651, approximately $224 per square foot. 1910 9th St N is a home located in Cass County with nearby schools including Washington Elementary School, Ben Franklin Middle School, and North High School.
Ownership History
Date
Name
Owned For
Owner Type
Purchase Details
Closed on
Nov 12, 2024
Sold by
Huebner Julie Ann
Bought by
Hubbard David S and Nudell Melissa J
Current Estimated Value
Purchase Details
Closed on
Oct 19, 2020
Sold by
Huebner Julie Ann and Estate Of Beverly Joyce Hubbar
Bought by
Hubbard David S and Nudell Melissa
Create a Home Valuation Report for This Property
The Home Valuation Report is an in-depth analysis detailing your home's value as well as a comparison with similar homes in the area
Home Values in the Area
Average Home Value in this Area
Purchase History
| Date | Buyer | Sale Price | Title Company |
|---|---|---|---|
| Hubbard David S | -- | None Listed On Document | |
| Hubbard David S | $104,250 | Fm Title |
Source: Public Records
Tax History
| Year | Tax Paid | Tax Assessment Tax Assessment Total Assessment is a certain percentage of the fair market value that is determined by local assessors to be the total taxable value of land and additions on the property. | Land | Improvement |
|---|---|---|---|---|
| 2024 | $2,914 | $106,900 | $26,550 | $80,350 |
| 2023 | $2,738 | $100,850 | $26,550 | $74,300 |
| 2022 | $2,627 | $95,150 | $26,550 | $68,600 |
| 2021 | $2,507 | $92,400 | $26,550 | $65,850 |
| 2020 | $2,316 | $86,350 | $26,550 | $59,800 |
| 2019 | $2,349 | $86,350 | $14,750 | $71,600 |
| 2018 | $2,068 | $77,750 | $14,750 | $63,000 |
| 2017 | $1,988 | $75,500 | $14,750 | $60,750 |
| 2016 | $1,798 | $68,650 | $14,750 | $53,900 |
| 2015 | $1,980 | $68,650 | $11,050 | $57,600 |
| 2014 | $2,047 | $69,250 | $11,050 | $58,200 |
| 2013 | $1,972 | $65,950 | $11,050 | $54,900 |
Source: Public Records
Map
Nearby Homes
- 2001 8th St N
- 801 17th Ave N
- 3216 Broadway N
- 1830 4th St N
- 1630 7th St N
- 1647 Broadway N
- 2501 9th St N
- 301 21st Ave N
- 1613 10th St N
- 1625 11th St N
- 1626 11th St N
- 306 25th Ave N
- 2814 10th St N
- 77 18th Ave N
- 105 24th Ave N
- 1441 Broadway N Unit 203
- 1451 12th St N
- 1437 Broadway N Unit 101
- 2807 Edgewood Dr N
- 1329 10th St N
Your Personal Tour Guide
Ask me questions while you tour the home.