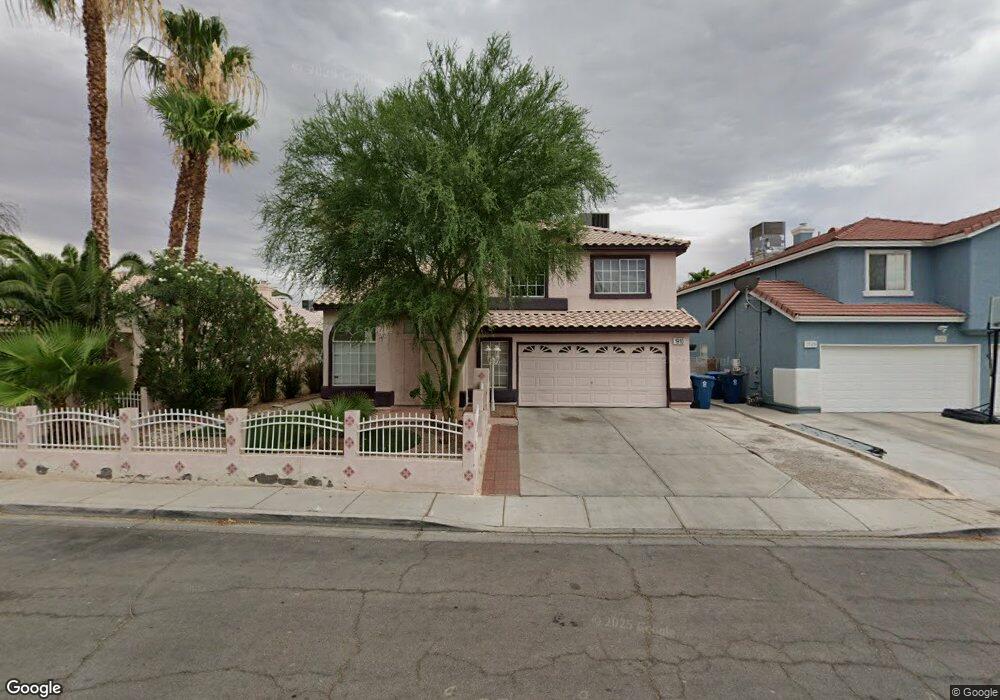
1910 Blue Ribbon Dr Las Vegas, NV 89142
Estimated Value: $413,111 - $450,000
4
Beds
3
Baths
2,007
Sq Ft
$215/Sq Ft
Est. Value
About This Home
This home is located at 1910 Blue Ribbon Dr, Las Vegas, NV 89142 and is currently estimated at $431,278, approximately $214 per square foot. 1910 Blue Ribbon Dr is a home located in Clark County with nearby schools including Dan Goldfarb Elementary School, Kathleen & Tim Harney Middle School, and Las Vegas High School.
Ownership History
Date
Name
Owned For
Owner Type
Purchase Details
Closed on
Jun 24, 2003
Sold by
To Tinh C and To Nguyen T
Bought by
Gurrola Fermin S and Gurrola Saida I
Current Estimated Value
Home Financials for this Owner
Home Financials are based on the most recent Mortgage that was taken out on this home.
Original Mortgage
$120,000
Outstanding Balance
$50,999
Interest Rate
5.37%
Mortgage Type
Unknown
Estimated Equity
$380,279
Purchase Details
Closed on
Nov 2, 1994
Sold by
To Tinh Cong and To Nguyen Thi
Bought by
To Tinh C and To Nguyen T
Home Financials for this Owner
Home Financials are based on the most recent Mortgage that was taken out on this home.
Original Mortgage
$93,500
Interest Rate
8.78%
Purchase Details
Closed on
May 27, 1994
Sold by
Lewis Properties
Bought by
To Tinh Cong and To Nguyen Thi
Home Financials for this Owner
Home Financials are based on the most recent Mortgage that was taken out on this home.
Original Mortgage
$93,675
Interest Rate
9.25%
Create a Home Valuation Report for This Property
The Home Valuation Report is an in-depth analysis detailing your home's value as well as a comparison with similar homes in the area
Home Values in the Area
Average Home Value in this Area
Purchase History
| Date | Buyer | Sale Price | Title Company |
|---|---|---|---|
| Gurrola Fermin S | $169,000 | United Title Of Nevada | |
| To Tinh C | -- | Land Title | |
| To Tinh Cong | $125,000 | Stewart Title |
Source: Public Records
Mortgage History
| Date | Status | Borrower | Loan Amount |
|---|---|---|---|
| Open | Gurrola Fermin S | $120,000 | |
| Previous Owner | To Tinh C | $93,500 | |
| Previous Owner | To Tinh Cong | $93,675 |
Source: Public Records
Tax History Compared to Growth
Tax History
| Year | Tax Paid | Tax Assessment Tax Assessment Total Assessment is a certain percentage of the fair market value that is determined by local assessors to be the total taxable value of land and additions on the property. | Land | Improvement |
|---|---|---|---|---|
| 2025 | $1,662 | $86,373 | $24,850 | $61,523 |
| 2024 | $1,539 | $86,373 | $24,850 | $61,523 |
| 2023 | $1,539 | $87,475 | $28,700 | $58,775 |
| 2022 | $1,426 | $77,440 | $23,450 | $53,990 |
| 2021 | $1,320 | $72,964 | $21,350 | $51,614 |
| 2020 | $1,223 | $72,017 | $20,650 | $51,367 |
| 2019 | $1,146 | $68,455 | $17,850 | $50,605 |
| 2018 | $1,094 | $63,402 | $14,700 | $48,702 |
| 2017 | $1,840 | $62,731 | $13,300 | $49,431 |
| 2016 | $1,025 | $52,203 | $9,450 | $42,753 |
| 2015 | $1,022 | $42,968 | $8,050 | $34,918 |
| 2014 | $992 | $35,023 | $7,000 | $28,023 |
Source: Public Records
Map
Nearby Homes
- 1779 Pineapple Tree Ct
- 6233 Apple Orchard Dr
- 6311 American Beauty Ave
- 6092 Golden Nectar Way
- 6094 Bing Cherry Dr
- 2179 Raspberry Hill Rd
- 6384 Cornstalk Cir
- 6260 Peach Orchard Rd
- 2316 Tulip Field St
- 6053 Wild Berry Dr
- 1950 Turtlerock St
- 1747 Angel Falls St
- 6275 Allspice Ct
- 2234 Falling Rain Dr
- 6080 Saint Petersburg Dr
- 6170 E Sahara Ave Unit 1031
- 6028 Las Nubes Dr
- 2097 Audrey Hepburn St
- 5849 Emerald Canyon Dr
- 1603 Teardrop St
- 1928 Blue Ribbon Dr
- 1890 Blue Ribbon Dr
- 1968 Red Maple Ct
- 1942 Blue Ribbon Dr
- 1876 Blue Ribbon Dr
- 1876 Blue Ribbon Dr
- 1876 Blue Ribbon Dr
- 1915 Blue Ribbon Dr
- 1903 Blue Ribbon Dr
- 1976 Red Maple Ct
- 1976 Red Maple Ct Unit na
- 1858 Blue Ribbon Dr
- 1929 Blue Ribbon Dr
- 1953 Lily Pad Cir
- 1889 Blue Ribbon Dr
- 1974 Blue Ribbon Dr
- 1961 Lily Pad Cir
- 1941 Blue Ribbon Dr
- 1877 Blue Ribbon Dr
- 6192 American Beauty Ave