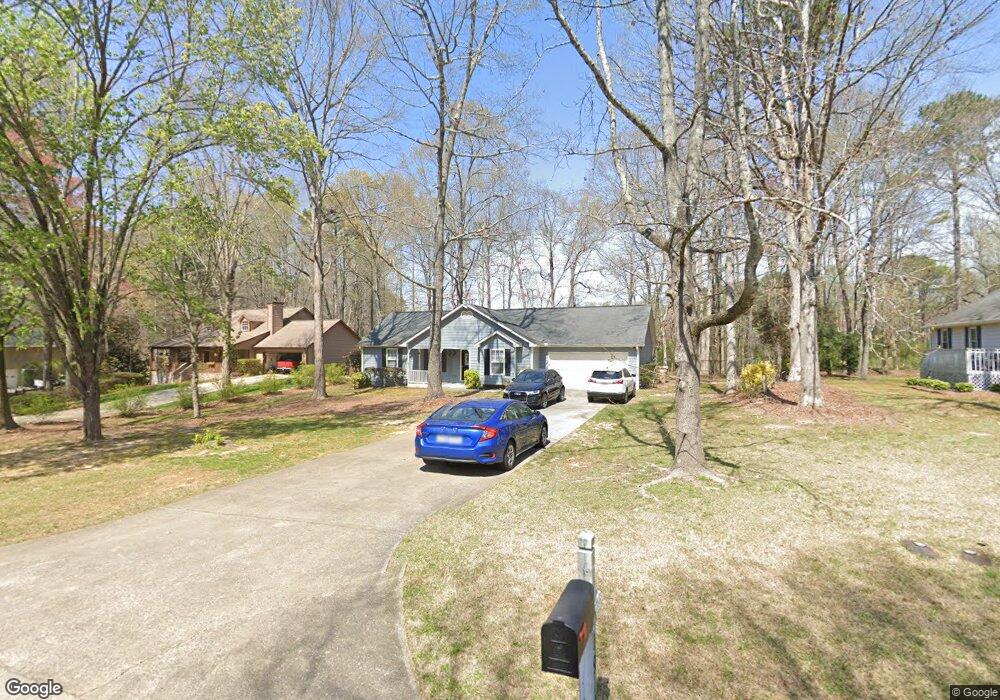
1910 Chadwick Dr Cumming, GA 30028
Estimated Value: $362,000 - $418,097
3
Beds
2
Baths
1,638
Sq Ft
$234/Sq Ft
Est. Value
About This Home
This home is located at 1910 Chadwick Dr, Cumming, GA 30028 and is currently estimated at $382,524, approximately $233 per square foot. 1910 Chadwick Dr is a home located in Forsyth County with nearby schools including Sawnee Elementary School, Otwell Middle School, and Forsyth Central High School.
Ownership History
Date
Name
Owned For
Owner Type
Purchase Details
Closed on
Nov 29, 2023
Sold by
Tah 2017-2 Borrower Llc
Bought by
Tricon Sfr 2023-2 Borrower Llc
Current Estimated Value
Home Financials for this Owner
Home Financials are based on the most recent Mortgage that was taken out on this home.
Original Mortgage
$389,379,000
Outstanding Balance
$269,575,196
Interest Rate
7.63%
Mortgage Type
New Conventional
Estimated Equity
-$269,192,672
Purchase Details
Closed on
Dec 20, 2017
Sold by
2012 C Property Holdings L
Bought by
Tah 2017 2 Borrower Llc
Purchase Details
Closed on
Nov 6, 2012
Sold by
Evans Karen M
Bought by
2012 C Property Holdings Llc
Purchase Details
Closed on
Feb 29, 2008
Sold by
Lee Virginia
Bought by
Evans Karen M
Home Financials for this Owner
Home Financials are based on the most recent Mortgage that was taken out on this home.
Original Mortgage
$120,000
Interest Rate
5.65%
Mortgage Type
New Conventional
Create a Home Valuation Report for This Property
The Home Valuation Report is an in-depth analysis detailing your home's value as well as a comparison with similar homes in the area
Home Values in the Area
Average Home Value in this Area
Purchase History
| Date | Buyer | Sale Price | Title Company |
|---|---|---|---|
| Tricon Sfr 2023-2 Borrower Llc | -- | None Listed On Document | |
| Tah 2017 2 Borrower Llc | -- | -- | |
| 2012 C Property Holdings Llc | -- | -- | |
| Evans Karen M | $160,000 | -- |
Source: Public Records
Mortgage History
| Date | Status | Borrower | Loan Amount |
|---|---|---|---|
| Open | Tricon Sfr 2023-2 Borrower Llc | $389,379,000 | |
| Previous Owner | Evans Karen M | $120,000 |
Source: Public Records
Tax History Compared to Growth
Tax History
| Year | Tax Paid | Tax Assessment Tax Assessment Total Assessment is a certain percentage of the fair market value that is determined by local assessors to be the total taxable value of land and additions on the property. | Land | Improvement |
|---|---|---|---|---|
| 2025 | $3,392 | $138,344 | $48,000 | $90,344 |
| 2024 | $3,392 | $138,344 | $48,000 | $90,344 |
| 2023 | $3,227 | $131,092 | $40,000 | $91,092 |
| 2022 | $2,529 | $87,996 | $28,000 | $59,996 |
| 2021 | $2,430 | $87,996 | $28,000 | $59,996 |
| 2020 | $2,289 | $82,908 | $24,000 | $58,908 |
| 2019 | $2,184 | $78,976 | $22,000 | $56,976 |
| 2018 | $1,758 | $63,564 | $22,000 | $41,564 |
| 2017 | $1,734 | $62,468 | $22,000 | $40,468 |
| 2016 | $1,734 | $62,468 | $22,000 | $40,468 |
| 2015 | $1,573 | $56,588 | $18,000 | $38,588 |
| 2014 | $1,415 | $53,460 | $0 | $0 |
Source: Public Records
Map
Nearby Homes
- 1565 Dr Bramblett Rd
- 2795 Roper Rd
- 1735 Gordon Rd
- 5340 Memento Trace
- 2615 Yellowstone Farm Dr
- 2165 Robin Hood Trail
- 2725 Yellowstone Farm Dr
- 2755 Marie Way
- 2275 Doctor Bramblett Rd
- 2765 Marie Way
- 2775 Marie Way
- 1210 Magnolia Park Cir
- 4900 Spot Rd
- 2610 Misty Hollow Ln
- 1009 Canton Hwy
- 1850 Overlook Springs Ln
- 3285 Stock Saddle Place
- 3115 Corsair Curve
- 1920 Chadwick Dr
- 1900 Chadwick Dr
- 1890 Chadwick Dr
- 1930 Chadwick Dr
- 1905 Chadwick Dr
- 1885 Chadwick Dr
- 1885 Chadwick Dr Unit 1885
- 1940 Chadwick Dr
- 1880 Chadwick Dr
- 1880 Chadwick Dr Unit 8
- 1925 Chadwick Dr
- 1910 Bramblett Place
- 1935 Chadwick Dr
- 1870 Chadwick Dr
- 1870 Chadwick Dr
- 1945 Chadwick Dr
- 1950 Chadwick Dr
- 1920 Bramblett Place
- 1860 Chadwick Dr
- 1960 Chadwick Dr