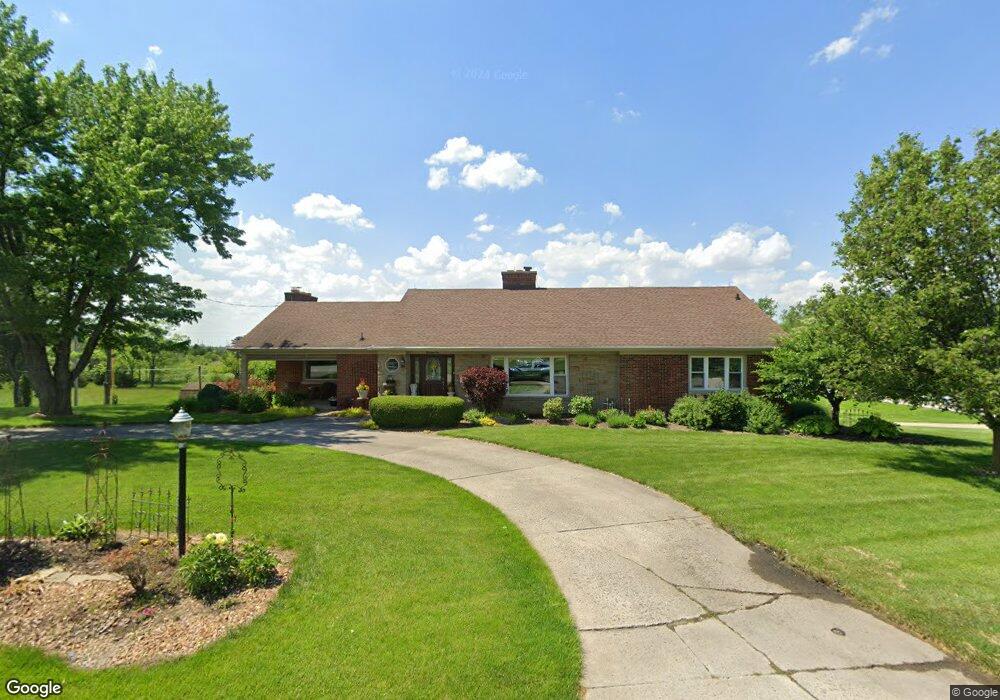
1910 Christy Rd Fremont, OH 43420
Estimated Value: $225,000 - $319,000
2
Beds
3
Baths
2,480
Sq Ft
$114/Sq Ft
Est. Value
About This Home
This home is located at 1910 Christy Rd, Fremont, OH 43420 and is currently estimated at $283,075, approximately $114 per square foot. 1910 Christy Rd is a home located in Sandusky County with nearby schools including Fremont Ross High School, St. Ann Catholic School, and St. Joseph School.
Ownership History
Date
Name
Owned For
Owner Type
Purchase Details
Closed on
Dec 29, 2003
Sold by
Hicks George A and Hicks Lourdes M
Bought by
Jones Steven P and Jones Nancy A
Current Estimated Value
Home Financials for this Owner
Home Financials are based on the most recent Mortgage that was taken out on this home.
Original Mortgage
$227,183
Outstanding Balance
$105,802
Interest Rate
5.84%
Mortgage Type
Purchase Money Mortgage
Estimated Equity
$177,273
Purchase Details
Closed on
May 25, 2001
Sold by
Bick Andrew J
Bought by
Hicks George A and Hicks Lourdes M
Home Financials for this Owner
Home Financials are based on the most recent Mortgage that was taken out on this home.
Original Mortgage
$197,500
Interest Rate
7.07%
Mortgage Type
New Conventional
Purchase Details
Closed on
Dec 1, 1991
Bought by
Jones Steven P and Jones Nancy A
Create a Home Valuation Report for This Property
The Home Valuation Report is an in-depth analysis detailing your home's value as well as a comparison with similar homes in the area
Home Values in the Area
Average Home Value in this Area
Purchase History
| Date | Buyer | Sale Price | Title Company |
|---|---|---|---|
| Jones Steven P | -- | Midland Title | |
| Hicks George A | $195,000 | -- | |
| Jones Steven P | $131,000 | -- |
Source: Public Records
Mortgage History
| Date | Status | Borrower | Loan Amount |
|---|---|---|---|
| Open | Jones Steven P | $227,183 | |
| Closed | Hicks George A | $197,500 |
Source: Public Records
Tax History Compared to Growth
Tax History
| Year | Tax Paid | Tax Assessment Tax Assessment Total Assessment is a certain percentage of the fair market value that is determined by local assessors to be the total taxable value of land and additions on the property. | Land | Improvement |
|---|---|---|---|---|
| 2024 | $3,328 | $88,450 | $10,960 | $77,490 |
| 2023 | $3,328 | $70,740 | $8,750 | $61,990 |
| 2022 | $2,829 | $70,740 | $8,750 | $61,990 |
| 2021 | $2,918 | $70,740 | $8,750 | $61,990 |
| 2020 | $2,634 | $62,760 | $8,750 | $54,010 |
| 2019 | $2,630 | $62,760 | $8,750 | $54,010 |
| 2018 | $2,635 | $62,760 | $8,750 | $54,010 |
| 2017 | $2,438 | $57,860 | $8,750 | $49,110 |
| 2016 | $2,148 | $57,860 | $8,750 | $49,110 |
| 2015 | $2,113 | $57,860 | $8,750 | $49,110 |
| 2014 | $2,314 | $60,340 | $9,310 | $51,030 |
| 2013 | $2,265 | $60,340 | $9,310 | $51,030 |
Source: Public Records
Map
Nearby Homes