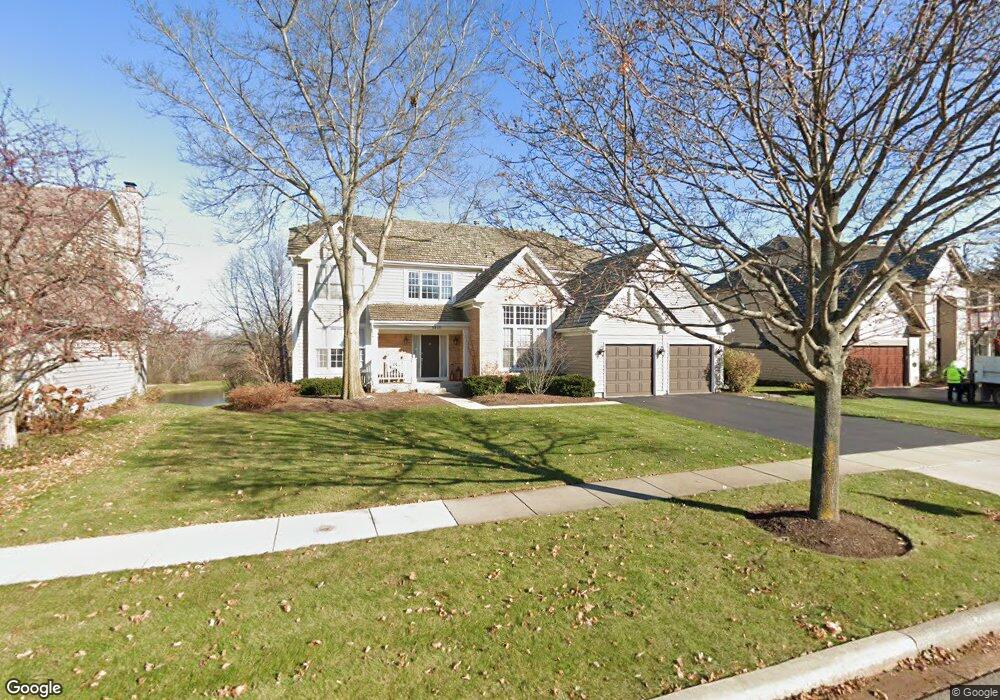
1910 Darnell St Libertyville, IL 60048
Estimated Value: $786,358 - $911,000
4
Beds
3
Baths
3,007
Sq Ft
$289/Sq Ft
Est. Value
About This Home
This home is located at 1910 Darnell St, Libertyville, IL 60048 and is currently estimated at $869,590, approximately $289 per square foot. 1910 Darnell St is a home located in Lake County with nearby schools including Adler Park School, Highland Middle School, and Libertyville High School.
Ownership History
Date
Name
Owned For
Owner Type
Purchase Details
Closed on
Jun 8, 2004
Sold by
Emc Mortgage Corp
Bought by
Prey Douglas and Prey Patricia
Current Estimated Value
Home Financials for this Owner
Home Financials are based on the most recent Mortgage that was taken out on this home.
Original Mortgage
$445,000
Outstanding Balance
$210,205
Interest Rate
5.5%
Mortgage Type
Purchase Money Mortgage
Estimated Equity
$659,385
Purchase Details
Closed on
Nov 14, 2003
Sold by
Koenig Tim J
Bought by
Emc Mortgage Corp
Purchase Details
Closed on
Sep 15, 1994
Sold by
Northern Tr Bank Lake Forest Natl Assn
Bought by
Koenig Tim J and Koenig Mary Beth
Home Financials for this Owner
Home Financials are based on the most recent Mortgage that was taken out on this home.
Original Mortgage
$318,550
Interest Rate
8.5%
Create a Home Valuation Report for This Property
The Home Valuation Report is an in-depth analysis detailing your home's value as well as a comparison with similar homes in the area
Home Values in the Area
Average Home Value in this Area
Purchase History
| Date | Buyer | Sale Price | Title Company |
|---|---|---|---|
| Prey Douglas | $595,000 | Stewart Title Company | |
| Emc Mortgage Corp | -- | -- | |
| Koenig Tim J | $354,500 | -- |
Source: Public Records
Mortgage History
| Date | Status | Borrower | Loan Amount |
|---|---|---|---|
| Open | Prey Douglas | $445,000 | |
| Previous Owner | Koenig Tim J | $318,550 | |
| Closed | Prey Douglas | $120,250 |
Source: Public Records
Tax History Compared to Growth
Tax History
| Year | Tax Paid | Tax Assessment Tax Assessment Total Assessment is a certain percentage of the fair market value that is determined by local assessors to be the total taxable value of land and additions on the property. | Land | Improvement |
|---|---|---|---|---|
| 2024 | $17,154 | $226,325 | $56,849 | $169,476 |
| 2023 | $14,989 | $208,748 | $52,434 | $156,314 |
| 2022 | $14,989 | $189,540 | $50,399 | $139,141 |
| 2021 | $15,890 | $203,802 | $54,191 | $149,611 |
| 2020 | $15,301 | $200,376 | $53,280 | $147,096 |
| 2019 | $14,930 | $198,470 | $52,773 | $145,697 |
| 2018 | $13,304 | $182,711 | $39,680 | $143,031 |
| 2017 | $13,153 | $176,942 | $38,427 | $138,515 |
| 2016 | $12,673 | $167,765 | $36,434 | $131,331 |
| 2015 | $12,556 | $156,805 | $34,054 | $122,751 |
| 2014 | $13,212 | $148,549 | $32,930 | $115,619 |
| 2012 | $13,351 | $162,869 | $36,105 | $126,764 |
Source: Public Records
Map
Nearby Homes
- 1917 Halifax St
- 1834 Torrey Pkwy Unit 103
- 1801 Torrey Pkwy
- 178 Brookhill Rd
- 1708 Park Crest Ct
- 1338 Trinity Place
- 1960 Pinehurst Ct
- 1506 Bull Creek Dr
- 1935 Lynn Cir
- 832 Interlaken Ln
- 694 Parkside Ct
- 662 Parkside Ct
- 616 Parkside Ct
- 619 Parkside Ct
- 31132-31140 N Milwaukee Ave
- 212 W Ellis Ave
- 208 W Ellis Ave
- 204 W Ellis Ave
- 1211 Parliament Ct
- 922 N Milwaukee Ave Unit A
- 1912 Darnell St
- 1908 Darnell St
- 1914 Darnell St
- 1906 Darnell St
- 1911 Darnell St
- 1907 Darnell St
- 1916 Darnell St
- 1915 Darnell St
- 1904 Darnell St
- 1402 Castleton Rd
- 1919 Darnell St
- 1902 Darnell St
- 1900 Halifax St
- 1908 Halifax St
- 1912 Halifax St
- 1923 Darnell St
- 1816 Darnell St
- 1401 Castleton Rd
- 1920 Darnell St
- 1405 Castleton Rd