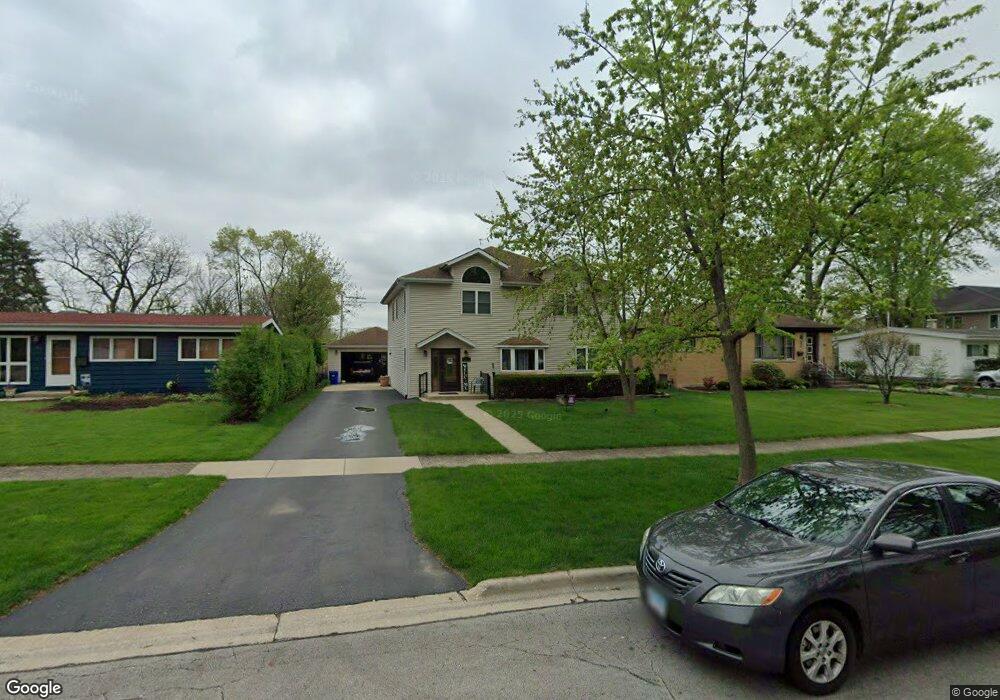
1910 E Evergreen St Wheaton, IL 60187
Estimated Value: $473,000 - $671,000
2
Beds
2
Baths
2,812
Sq Ft
$209/Sq Ft
Est. Value
About This Home
This home is located at 1910 E Evergreen St, Wheaton, IL 60187 and is currently estimated at $586,553, approximately $208 per square foot. 1910 E Evergreen St is a home located in DuPage County with nearby schools including Lowell Elementary School, Franklin Middle School, and Wheaton North High School.
Ownership History
Date
Name
Owned For
Owner Type
Purchase Details
Closed on
May 18, 1998
Sold by
Gardner Michael T and Gardner Lynn M
Bought by
Koprowski Quin J and Faley Catherine S
Current Estimated Value
Home Financials for this Owner
Home Financials are based on the most recent Mortgage that was taken out on this home.
Original Mortgage
$106,000
Outstanding Balance
$21,019
Interest Rate
7.27%
Estimated Equity
$565,534
Purchase Details
Closed on
Oct 25, 1993
Sold by
Gardner Michael T and Brophy James C
Bought by
Gardner Michael T
Home Financials for this Owner
Home Financials are based on the most recent Mortgage that was taken out on this home.
Original Mortgage
$70,000
Interest Rate
7.02%
Create a Home Valuation Report for This Property
The Home Valuation Report is an in-depth analysis detailing your home's value as well as a comparison with similar homes in the area
Home Values in the Area
Average Home Value in this Area
Purchase History
| Date | Buyer | Sale Price | Title Company |
|---|---|---|---|
| Koprowski Quin J | $116,000 | Premier Title Company | |
| Gardner Michael T | -- | Mid America Title Company |
Source: Public Records
Mortgage History
| Date | Status | Borrower | Loan Amount |
|---|---|---|---|
| Open | Koprowski Quin J | $106,000 | |
| Previous Owner | Gardner Michael T | $70,000 |
Source: Public Records
Tax History
| Year | Tax Paid | Tax Assessment Tax Assessment Total Assessment is a certain percentage of the fair market value that is determined by local assessors to be the total taxable value of land and additions on the property. | Land | Improvement |
|---|---|---|---|---|
| 2024 | $11,434 | $185,405 | $27,975 | $157,430 |
| 2023 | $10,993 | $170,660 | $25,750 | $144,910 |
| 2022 | $10,754 | $161,290 | $24,340 | $136,950 |
| 2021 | $10,720 | $157,460 | $23,760 | $133,700 |
| 2020 | $10,687 | $155,990 | $23,540 | $132,450 |
| 2019 | $10,443 | $151,870 | $22,920 | $128,950 |
| 2018 | $9,674 | $139,570 | $28,510 | $111,060 |
| 2017 | $9,531 | $134,420 | $27,460 | $106,960 |
| 2016 | $9,405 | $129,050 | $26,360 | $102,690 |
| 2015 | $9,335 | $123,120 | $25,150 | $97,970 |
| 2014 | $9,387 | $121,770 | $20,860 | $100,910 |
| 2013 | $9,145 | $122,130 | $20,920 | $101,210 |
Source: Public Records
Map
Nearby Homes
- 850 S Lorraine Rd Unit 3B
- 1000 S Lorraine Rd Unit 214
- 185 N Ott Ave
- 213 S Summit St
- 1344 S Lorraine Rd Unit C
- 1216 E Elm St
- 1019 Pershing Ave
- 510 S President St
- 1601 Castbourne Ct
- 37 N Main St Unit 40
- 119 N Main St
- 465 Arlington Ave
- 328 Lorraine St
- 388 Hill Ave
- 121 S Parkside Ave
- 1581 Groton Ln
- 1678 Groton Ct
- 404 Lawrence Ave
- 412 Lawrence Ave
- 230 Duane St Unit 3A
- 1906 E Evergreen St
- 1916 E Evergreen St
- 1920 E Evergreen St
- 1911 E Roosevelt Rd
- 1911 E Roosevelt Rd
- 1907 E Roosevelt Rd
- 1830 E Evergreen St
- 1924 E Evergreen St
- 1913 E Evergreen St
- 1917 E Evergreen St
- 1907 E Evergreen St
- 1826 E Evergreen St
- 1927 E Roosevelt Rd
- 1923 E Evergreen St
- 1903 E Evergreen St
- 1930 E Evergreen St
- 1927 E Evergreen St
- 1927 E Evergreen St
- 1820 E Evergreen St
- 1829 E Evergreen St
Your Personal Tour Guide
Ask me questions while you tour the home.