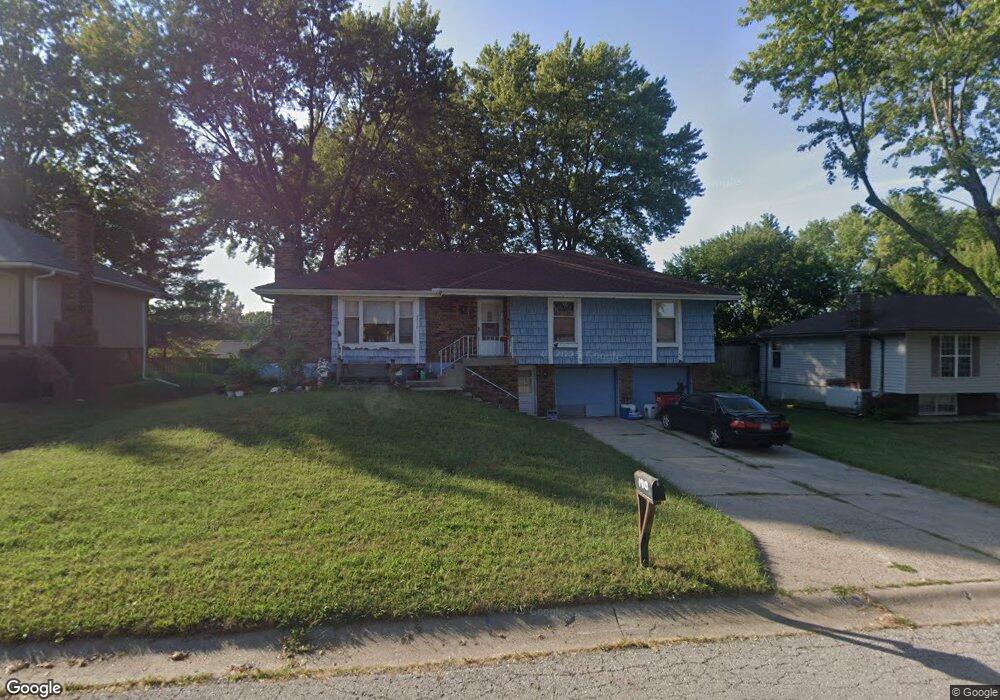
1910 N Concord Rd Independence, MO 64058
Estimated Value: $226,899 - $259,000
3
Beds
2
Baths
1,442
Sq Ft
$168/Sq Ft
Est. Value
About This Home
This home is located at 1910 N Concord Rd, Independence, MO 64058 and is currently estimated at $242,725, approximately $168 per square foot. 1910 N Concord Rd is a home located in Jackson County with nearby schools including Fort Osage High School.
Ownership History
Date
Name
Owned For
Owner Type
Purchase Details
Closed on
Jun 19, 2017
Sold by
Meador Mary S
Bought by
Meador Michael S
Current Estimated Value
Purchase Details
Closed on
May 16, 2001
Sold by
Jones Alicia R and Jones Reginald D
Bought by
Meador Michael S and Meador Mary S
Home Financials for this Owner
Home Financials are based on the most recent Mortgage that was taken out on this home.
Original Mortgage
$102,600
Outstanding Balance
$38,197
Interest Rate
6.99%
Mortgage Type
Purchase Money Mortgage
Estimated Equity
$204,528
Purchase Details
Closed on
Dec 15, 1999
Sold by
Simon Bruce E and Simon Sharie K
Bought by
Jones Reginald D and Jones Alicia R
Home Financials for this Owner
Home Financials are based on the most recent Mortgage that was taken out on this home.
Original Mortgage
$94,662
Interest Rate
7.86%
Mortgage Type
Purchase Money Mortgage
Create a Home Valuation Report for This Property
The Home Valuation Report is an in-depth analysis detailing your home's value as well as a comparison with similar homes in the area
Purchase History
| Date | Buyer | Sale Price | Title Company |
|---|---|---|---|
| Meador Michael S | -- | None Available | |
| Meador Michael S | -- | Realty Title Company | |
| Jones Reginald D | -- | Realty Title Co |
Source: Public Records
Mortgage History
| Date | Status | Borrower | Loan Amount |
|---|---|---|---|
| Open | Meador Michael S | $102,600 | |
| Previous Owner | Jones Reginald D | $94,662 |
Source: Public Records
Tax History
| Year | Tax Paid | Tax Assessment Tax Assessment Total Assessment is a certain percentage of the fair market value that is determined by local assessors to be the total taxable value of land and additions on the property. | Land | Improvement |
|---|---|---|---|---|
| 2025 | $3,551 | $29,900 | $6,004 | $23,896 |
| 2024 | $3,519 | $39,699 | $4,619 | $35,080 |
| 2023 | $3,519 | $39,699 | $4,285 | $35,414 |
| 2022 | $2,115 | $22,610 | $2,933 | $19,677 |
| 2021 | $2,118 | $22,610 | $2,933 | $19,677 |
| 2020 | $2,047 | $21,536 | $2,933 | $18,603 |
| 2019 | $2,005 | $21,536 | $2,933 | $18,603 |
| 2018 | $1,753 | $18,744 | $2,553 | $16,191 |
| 2017 | $1,753 | $18,744 | $2,553 | $16,191 |
| 2016 | $1,574 | $18,237 | $2,811 | $15,426 |
| 2014 | $1,550 | $17,879 | $2,756 | $15,123 |
Source: Public Records
Map
Nearby Homes
- 2001 N Concord Rd
- 19009 E 20th Terrace N
- 18310 E 18th St N
- 1608 N Lazy Branch Rd
- 1609 N Ponca Dr
- 1600 N Dover St
- 1612 N Ponca Dr
- 2113 N York Rd
- 19706 E 20th St N
- 19220 E 14th St N
- 1621 N Belvidere Ave
- 19113 E 14th St N
- 19704 E 14th Terrace N
- 20242 E 17th Street Ct N
- 19706 E 14th St N
- 1320 N Holland Ct
- 1801 N Davidson Rd
- 1317 N Holland Ct
- 1325 N Holland Ct
- 1232 N Sioux Ct
- 1908 N Concord Rd
- 1912 N Concord Rd
- 1911 N Lazy Branch Rd
- 1909 N Lazy Branch Rd
- 1909 N Concord Rd
- 1906 N Concord Rd
- 1911 N Concord Rd
- 1913 N Lazy Branch Rd
- 1914 N Concord Rd
- 1907 N Lazy Branch Rd
- 1915 N Lazy Branch Rd
- 1913 N Concord Rd
- 1904 N Concord Rd
- 1905 N Concord Rd
- 1903 N Dover St
- 1916 N Concord Rd
- 1905 N Lazy Branch Rd
- 1910 N Lazy Branch Rd
- 1908 N Lazy Branch Rd
- 2001 N Lazy Branch Rd
Your Personal Tour Guide
Ask me questions while you tour the home.