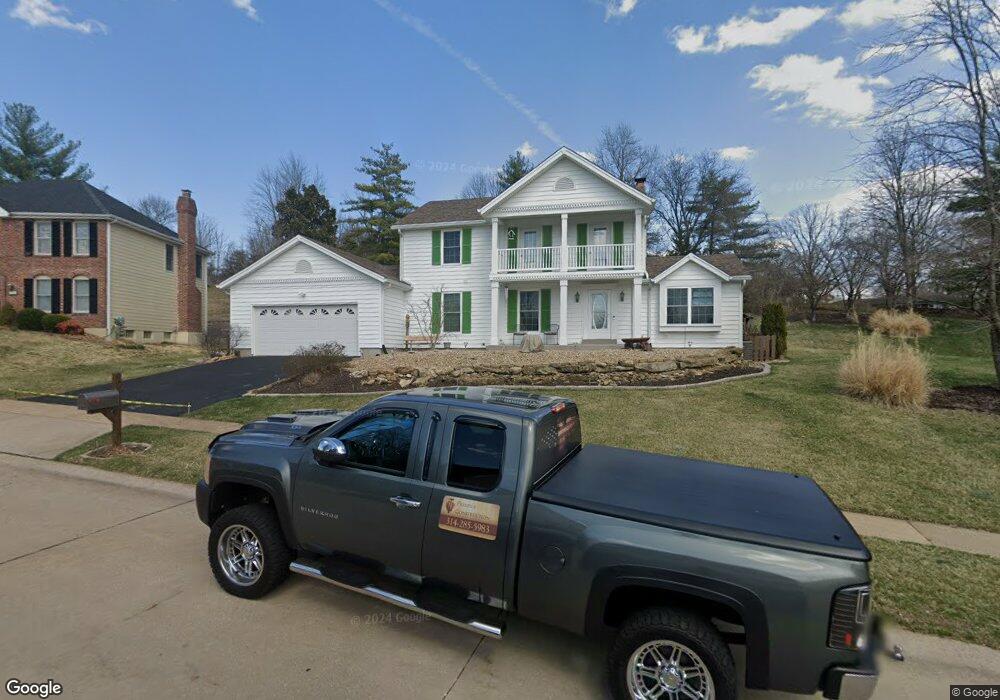
1910 Shadow Wood Ct Chesterfield, MO 63017
Estimated Value: $538,000 - $681,000
3
Beds
3
Baths
2,460
Sq Ft
$239/Sq Ft
Est. Value
About This Home
This home is located at 1910 Shadow Wood Ct, Chesterfield, MO 63017 and is currently estimated at $588,762, approximately $239 per square foot. 1910 Shadow Wood Ct is a home located in St. Louis County with nearby schools including Highcroft Ridge Elementary, Parkway Central Middle School, and Parkway Central High School.
Ownership History
Date
Name
Owned For
Owner Type
Purchase Details
Closed on
Oct 11, 2005
Sold by
Edelman Jeffrey M and Edelman Susan M
Bought by
Demunbrun Lisa L
Current Estimated Value
Home Financials for this Owner
Home Financials are based on the most recent Mortgage that was taken out on this home.
Original Mortgage
$175,000
Outstanding Balance
$93,491
Interest Rate
5.73%
Mortgage Type
Fannie Mae Freddie Mac
Estimated Equity
$495,271
Purchase Details
Closed on
Jul 15, 1999
Sold by
Su Wenpei and Zhu Hongbo
Bought by
Edelman Jefrey M and Edelman Susan M
Purchase Details
Closed on
Dec 30, 1997
Sold by
Farr Charles M and Farr Martha L
Bought by
Su Wenpei and Zhu Hongbo
Home Financials for this Owner
Home Financials are based on the most recent Mortgage that was taken out on this home.
Original Mortgage
$162,640
Interest Rate
7.14%
Create a Home Valuation Report for This Property
The Home Valuation Report is an in-depth analysis detailing your home's value as well as a comparison with similar homes in the area
Home Values in the Area
Average Home Value in this Area
Purchase History
| Date | Buyer | Sale Price | Title Company |
|---|---|---|---|
| Demunbrun Lisa L | $345,000 | -- | |
| Edelman Jefrey M | $225,250 | -- | |
| Su Wenpei | -- | -- |
Source: Public Records
Mortgage History
| Date | Status | Borrower | Loan Amount |
|---|---|---|---|
| Open | Demunbrun Lisa L | $175,000 | |
| Previous Owner | Su Wenpei | $162,640 |
Source: Public Records
Tax History Compared to Growth
Tax History
| Year | Tax Paid | Tax Assessment Tax Assessment Total Assessment is a certain percentage of the fair market value that is determined by local assessors to be the total taxable value of land and additions on the property. | Land | Improvement |
|---|---|---|---|---|
| 2025 | $5,557 | $100,760 | $45,430 | $55,330 |
| 2024 | $5,557 | $84,040 | $27,270 | $56,770 |
| 2023 | $5,557 | $84,040 | $27,270 | $56,770 |
| 2022 | $4,752 | $68,140 | $25,160 | $42,980 |
| 2021 | $4,732 | $68,140 | $25,160 | $42,980 |
| 2020 | $4,502 | $62,240 | $22,740 | $39,500 |
| 2019 | $4,404 | $62,240 | $22,740 | $39,500 |
| 2018 | $4,623 | $60,610 | $22,740 | $37,870 |
| 2017 | $4,497 | $60,610 | $22,740 | $37,870 |
| 2016 | $4,508 | $57,740 | $19,970 | $37,770 |
| 2015 | $4,726 | $57,740 | $19,970 | $37,770 |
| 2014 | $4,381 | $57,230 | $18,150 | $39,080 |
Source: Public Records
Map
Nearby Homes
- 15300 Grantley Dr
- 15000 S Outer 40 Rd
- 38 Baxter Ln
- 1812 Summer Lake Dr
- 86 Conway Cove Dr
- 2029 Cedarmill Dr
- 1507 Timberlake Manor Pkwy
- 1237 Cedar Creek Rd
- 1530 Bedford Forge Ct Unit 5
- 1511 Hampton Hall Dr Unit 19 & 20
- 15261 Springrun Dr
- 15593 Bedford Forge Dr Unit 6
- 1009 Cambridge Way Dr
- 1243 Still House Creek Rd
- 39 White Plains Dr
- 14629 Timberlake Manor Ct
- 15509 Hitchcock Rd
- 15486 Hitchcock Rd
- 15324 Appalachian Trail
- 1226 Luray Dr
- 1906 Shadow Wood Ct
- 1916 Shadow Wood Ct
- 1907 Shadow Wood Ct
- 1915 Shadow Wood Ct
- 1916 Farm Valley Dr
- 1928 Farm Valley Dr
- 1912 Farm Valley Dr
- 15307 Doverfield Ct
- 1934 Farm Valley Dr
- 1921 Shadow Wood Ct
- 1922 Shadow Wood Ct
- 1490 Schoettler Rd
- 1908 Farm Valley Dr
- 1484 Schoettler Rd
- 1913 Farm Valley Dr
- 1923 Farm Valley Dr
- 1940 Farm Valley Dr
- 1929 Farm Valley Dr
- 15311 Doverfield Ct
- 1925 Shadow Wood Ct