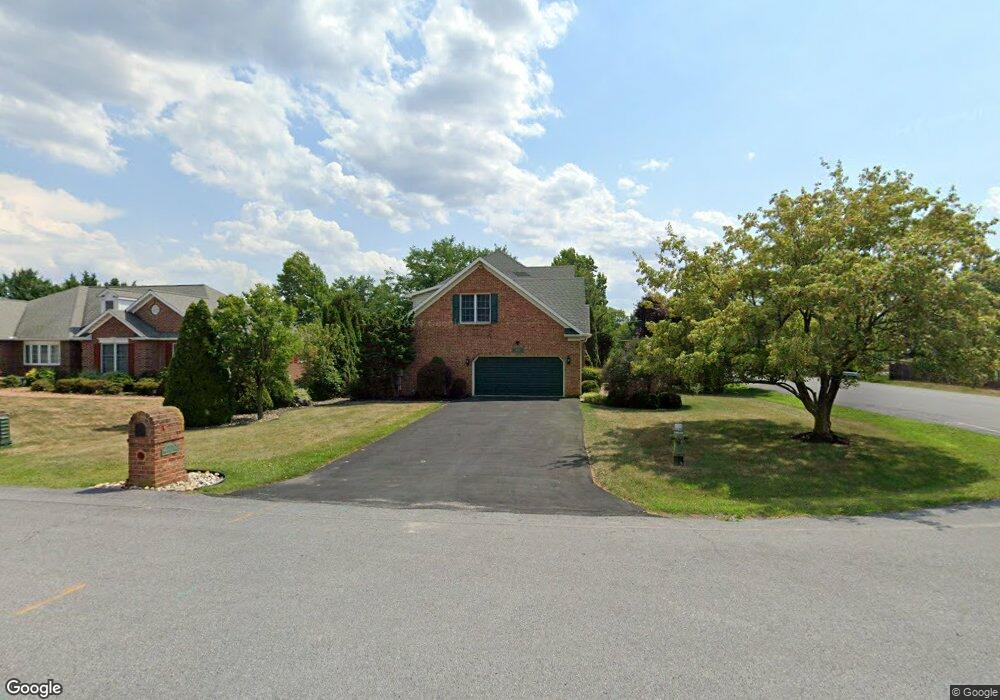
19101 Rock Maple Dr Hagerstown, MD 21742
Estimated Value: $478,000 - $566,000
5
Beds
3
Baths
2,718
Sq Ft
$190/Sq Ft
Est. Value
About This Home
This home is located at 19101 Rock Maple Dr, Hagerstown, MD 21742 and is currently estimated at $516,027, approximately $189 per square foot. 19101 Rock Maple Dr is a home located in Washington County with nearby schools including Paramount Elementary School, Otsego West Campus High School, and Northern Middle School.
Ownership History
Date
Name
Owned For
Owner Type
Purchase Details
Closed on
Aug 12, 2019
Sold by
Johnson David
Bought by
Johnson David and Jones Bud Nicholas
Current Estimated Value
Purchase Details
Closed on
Sep 5, 2018
Sold by
Johnson David
Bought by
Johnson Dillard Terri M
Purchase Details
Closed on
Aug 29, 2016
Sold by
Johnson David
Bought by
Johnson Dillard Terri M
Purchase Details
Closed on
Apr 1, 1999
Sold by
Tdr Construction Inc
Bought by
David Johnson
Purchase Details
Closed on
Apr 18, 1997
Sold by
Maple Valley Estate Inc
Bought by
T D R Construction Inc
Create a Home Valuation Report for This Property
The Home Valuation Report is an in-depth analysis detailing your home's value as well as a comparison with similar homes in the area
Home Values in the Area
Average Home Value in this Area
Purchase History
| Date | Buyer | Sale Price | Title Company |
|---|---|---|---|
| Johnson David | -- | None Available | |
| Johnson Dillard Terri M | -- | None Available | |
| Johnson Dillard Terri M | -- | Attorney | |
| David Johnson | $225,000 | -- | |
| T D R Construction Inc | $37,000 | -- |
Source: Public Records
Mortgage History
| Date | Status | Borrower | Loan Amount |
|---|---|---|---|
| Closed | T D R Construction Inc | -- |
Source: Public Records
Tax History Compared to Growth
Tax History
| Year | Tax Paid | Tax Assessment Tax Assessment Total Assessment is a certain percentage of the fair market value that is determined by local assessors to be the total taxable value of land and additions on the property. | Land | Improvement |
|---|---|---|---|---|
| 2025 | $3,998 | $404,133 | $0 | $0 |
| 2024 | $3,998 | $386,100 | $80,800 | $305,300 |
| 2023 | $3,758 | $361,300 | $0 | $0 |
| 2022 | $3,484 | $336,500 | $0 | $0 |
| 2021 | $3,219 | $311,700 | $80,800 | $230,900 |
| 2020 | $3,219 | $305,067 | $0 | $0 |
| 2019 | $3,163 | $298,433 | $0 | $0 |
| 2018 | $3,093 | $291,800 | $80,800 | $211,000 |
| 2017 | $3,010 | $283,933 | $0 | $0 |
| 2016 | -- | $276,067 | $0 | $0 |
| 2015 | $2,945 | $268,200 | $0 | $0 |
| 2014 | $2,945 | $268,200 | $0 | $0 |
Source: Public Records
Map
Nearby Homes
- 13407 Cherry Tree Cir
- 13514 Paradise Church Rd
- 19111 Black Maple Way
- 18930 Maple Valley Cir
- 13347 Keener Rd
- 13343 Keener Rd
- 13336 Keener Rd
- 13335 Keener Rd
- 13314 Newport Ct
- 19330 Longmeadow Rd
- 13717 Pulaski Dr
- 13709 Pulaski Dr
- Hemingway Plan at Paradise Heights
- Coronado Plan at Paradise Heights
- 19310 Smallwood Terrace
- 13710 Pulaski Dr
- 13702 Pulaski Dr
- 13800 Paradise Church Rd
- 13810 Pulaski Dr Unit 72
- 13209 Briarcliff Dr
- 19105 Rock Maple Dr
- 0 Corello Dr Unit 1008106360
- 0 Corello Dr Unit 1008035044
- 0 Corello Dr Unit 1008032784
- 0 Corello Dr Unit 1008032770
- 0 Corello Dr Unit 1007960456
- 0 Corello Dr Unit 1007959786
- 0 Corello Dr Unit 1007959670
- 0 Corello Dr Unit WA10127590
- 0 Corello Dr Unit WA10127568
- 0 Corello Dr Unit WA10093837
- 0 Corello Dr Unit WA10093800
- 0 Corello Dr Unit WA9549410
- 0 Corello Dr Unit WA8753749
- 0 Corello Dr Unit WA8751074
- 0 Corello Dr Unit WA8751061
- 0 Corello Dr Unit 1003974715
- 0 Corello Dr Unit 1003974843
- 0 Corello Dr Unit 1004390921
- 0 Corello Dr Unit 1004390997