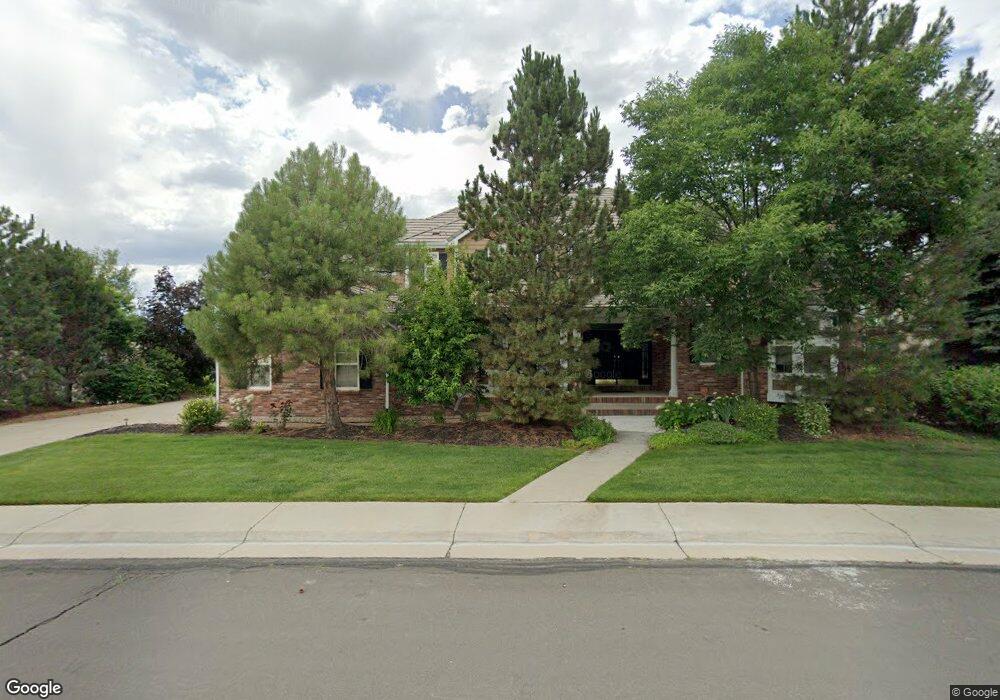
19109 E Maplewood Place Aurora, CO 80016
Tuscany NeighborhoodEstimated Value: $992,320 - $1,214,000
4
Beds
7
Baths
4,147
Sq Ft
$275/Sq Ft
Est. Value
About This Home
This home is located at 19109 E Maplewood Place, Aurora, CO 80016 and is currently estimated at $1,141,080, approximately $275 per square foot. 19109 E Maplewood Place is a home located in Arapahoe County with nearby schools including Rolling Hills Elementary School, Falcon Creek Middle School, and Grandview High School.
Ownership History
Date
Name
Owned For
Owner Type
Purchase Details
Closed on
Oct 12, 2004
Sold by
Millage Eric D
Bought by
Millage Eric D and Millage Jeanne R
Current Estimated Value
Home Financials for this Owner
Home Financials are based on the most recent Mortgage that was taken out on this home.
Original Mortgage
$333,700
Outstanding Balance
$152,404
Interest Rate
4.62%
Mortgage Type
Purchase Money Mortgage
Estimated Equity
$988,676
Purchase Details
Closed on
May 25, 2001
Sold by
Sanford Homes Of Colorado Lllp
Bought by
Abel Terry B and Abel Amy E
Home Financials for this Owner
Home Financials are based on the most recent Mortgage that was taken out on this home.
Original Mortgage
$504,000
Interest Rate
7.07%
Purchase Details
Closed on
Sep 18, 2000
Sold by
Richmond American Homes Of Colorado Inc
Bought by
Sanford Homes Of Colorado Lllp
Create a Home Valuation Report for This Property
The Home Valuation Report is an in-depth analysis detailing your home's value as well as a comparison with similar homes in the area
Home Values in the Area
Average Home Value in this Area
Purchase History
| Date | Buyer | Sale Price | Title Company |
|---|---|---|---|
| Millage Eric D | -- | Land Title | |
| Millage Eric D | $595,000 | Land Title | |
| Abel Terry B | $644,690 | -- | |
| Sanford Homes Of Colorado Lllp | $219,147 | Land Title |
Source: Public Records
Mortgage History
| Date | Status | Borrower | Loan Amount |
|---|---|---|---|
| Open | Millage Eric D | $333,700 | |
| Previous Owner | Abel Terry B | $504,000 | |
| Closed | Millage Eric D | $201,800 |
Source: Public Records
Tax History Compared to Growth
Tax History
| Year | Tax Paid | Tax Assessment Tax Assessment Total Assessment is a certain percentage of the fair market value that is determined by local assessors to be the total taxable value of land and additions on the property. | Land | Improvement |
|---|---|---|---|---|
| 2024 | $7,029 | $74,028 | -- | -- |
| 2023 | $7,029 | $74,028 | $0 | $0 |
| 2022 | $5,300 | $52,410 | $0 | $0 |
| 2021 | $5,323 | $52,410 | $0 | $0 |
| 2020 | $5,155 | $51,773 | $0 | $0 |
| 2019 | $5,030 | $51,773 | $0 | $0 |
| 2018 | $5,257 | $48,305 | $0 | $0 |
| 2017 | $5,172 | $48,305 | $0 | $0 |
| 2016 | $5,470 | $48,644 | $0 | $0 |
| 2015 | $5,286 | $48,644 | $0 | $0 |
| 2014 | $4,899 | $41,026 | $0 | $0 |
| 2013 | -- | $42,700 | $0 | $0 |
Source: Public Records
Map
Nearby Homes
- 19242 E Maplewood Place
- 6172 S Dunkirk St
- 19043 E Low Dr
- 6492 S Piney Creek Cir
- 5863 S Danube St
- 6368 S Walden Way
- 5860 S Espana St
- 6102 S Yampa St
- 6269 S Yampa Ct
- 6043 S Waco St
- 18980 E Garden Dr
- 18869 E Berry Place
- 19052 E Briarwood Dr
- 5745 S Andes St
- 20234 E Lake Cir
- 18450 E Powers Place
- 19333 E Briarwood Place
- 6834 S Ensenada St
- 6776 S Flanders Ct
- 18337 E Powers Place
- 19129 E Maplewood Place
- 6130 S Cathay Ct
- 19114 E Fair Dr
- 6120 S Cathay Ct
- 19120 E Maplewood Place
- 19149 E Maplewood Place
- 6140 S Cathay Ct
- 19076 E Maplewood Ave
- 19134 E Fair Dr
- 6110 S Cathay Ct
- 19160 E Maplewood Place
- 19108 E Maplewood Ave
- 19153 E Fair Dr
- 19169 E Maplewood Place
- 6129 S Cathay Ct
- 19203 E Fair Place
- 19128 E Maplewood Ave
- 6139 S Cathay Ct
- 6109 S Cathay Ct
- 19190 E Maplewood Place