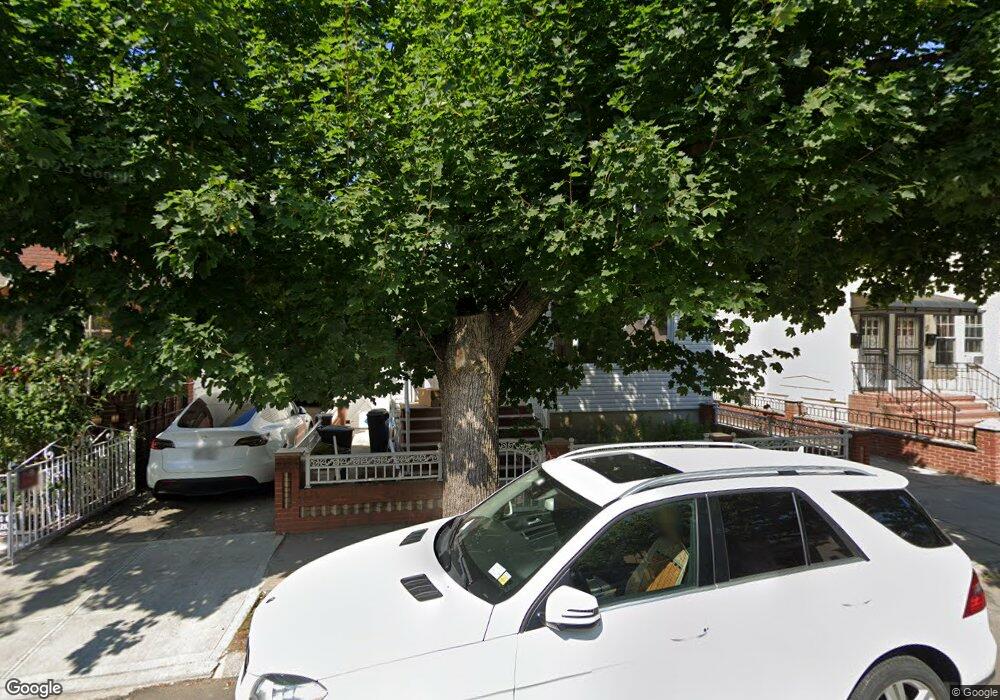
1911 80th St Unit 1913 Brooklyn, NY 11214
Bensonhurst NeighborhoodEstimated Value: $1,701,000 - $1,995,438
Studio
--
Bath
2,964
Sq Ft
$626/Sq Ft
Est. Value
About This Home
This home is located at 1911 80th St Unit 1913, Brooklyn, NY 11214 and is currently estimated at $1,854,110, approximately $625 per square foot. 1911 80th St Unit 1913 is a home located in Kings County with nearby schools including P.S. 186 Dr. Irving A. Gladstone Elementary School, Seth Low Intermediate School 96, and New Utrecht High School.
Ownership History
Date
Name
Owned For
Owner Type
Purchase Details
Closed on
May 10, 2022
Sold by
Yigit Meryem and Yigit Raif
Bought by
Min Huang Shun
Current Estimated Value
Home Financials for this Owner
Home Financials are based on the most recent Mortgage that was taken out on this home.
Original Mortgage
$700,000
Outstanding Balance
$665,104
Interest Rate
5.27%
Mortgage Type
Purchase Money Mortgage
Estimated Equity
$1,189,006
Purchase Details
Closed on
Mar 14, 2000
Sold by
Calderone Anthony J
Bought by
Yigit Raif and Yigit Meryem
Create a Home Valuation Report for This Property
The Home Valuation Report is an in-depth analysis detailing your home's value as well as a comparison with similar homes in the area
Home Values in the Area
Average Home Value in this Area
Purchase History
| Date | Buyer | Sale Price | Title Company |
|---|---|---|---|
| Min Huang Shun | $1,500,000 | -- | |
| Yigit Raif | $420,000 | -- |
Source: Public Records
Mortgage History
| Date | Status | Borrower | Loan Amount |
|---|---|---|---|
| Open | Min Huang Shun | $700,000 |
Source: Public Records
Tax History
| Year | Tax Paid | Tax Assessment Tax Assessment Total Assessment is a certain percentage of the fair market value that is determined by local assessors to be the total taxable value of land and additions on the property. | Land | Improvement |
|---|---|---|---|---|
| 2025 | $10,722 | $114,960 | $21,600 | $93,360 |
| 2024 | $10,722 | $101,460 | $21,600 | $79,860 |
| 2023 | $10,228 | $110,220 | $21,600 | $88,620 |
| 2022 | $9,395 | $101,520 | $21,600 | $79,920 |
| 2021 | $8,268 | $101,460 | $21,600 | $79,860 |
| 2019 | $7,056 | $89,220 | $21,600 | $67,620 |
| 2018 | $5,330 | $41,968 | $11,167 | $30,801 |
| 2017 | $7,909 | $41,968 | $9,349 | $32,619 |
| 2016 | $7,705 | $41,650 | $12,526 | $29,124 |
| 2015 | $4,556 | $39,294 | $10,809 | $28,485 |
| 2014 | $4,556 | $37,070 | $12,237 | $24,833 |
Source: Public Records
Map
Nearby Homes
- 1939 80th St
- 1973 81st St Unit C10
- 1859 80th St
- 1927 78th St Unit 4A
- 2024 80th St
- 1839 79th St Unit 1B
- 2027 78th St
- 2029 82nd St
- 1812 80th St
- 1827 78th St Unit 1B
- 2039 78th St
- 8001 18th Ave
- 7801 18th Ave
- 1912 Bay Ridge Pkwy
- 1857 84th St
- 2021 84th St Unit L3
- 8405 19th Ave Unit 1B
- 8405 19th Ave Unit 3B
- 8405 19th Ave Unit 2B
- 8403 19th Ave Unit 1A
Your Personal Tour Guide
Ask me questions while you tour the home.