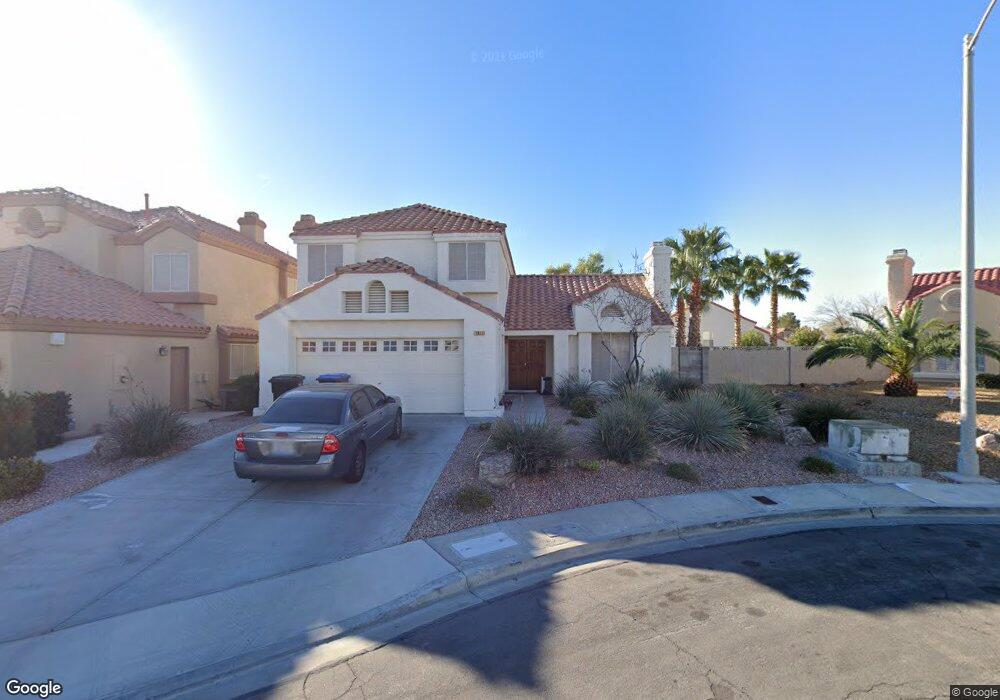
1911 Allen Grove Ct Henderson, NV 89074
Green Valley North NeighborhoodEstimated Value: $438,672 - $507,000
3
Beds
3
Baths
1,761
Sq Ft
$268/Sq Ft
Est. Value
About This Home
This home is located at 1911 Allen Grove Ct, Henderson, NV 89074 and is currently estimated at $472,668, approximately $268 per square foot. 1911 Allen Grove Ct is a home located in Clark County with nearby schools including James Gibson Elementary School, Barbara and Hank Greenspun Junior High School, and Green Valley High School.
Ownership History
Date
Name
Owned For
Owner Type
Purchase Details
Closed on
Sep 12, 2002
Sold by
Glynn John C
Bought by
Glynn John C and Dissmore Dia G
Current Estimated Value
Purchase Details
Closed on
Jun 28, 1999
Sold by
Linderman Christina Michelle and Glynn Kathryn A
Bought by
Glynn John C
Create a Home Valuation Report for This Property
The Home Valuation Report is an in-depth analysis detailing your home's value as well as a comparison with similar homes in the area
Home Values in the Area
Average Home Value in this Area
Purchase History
| Date | Buyer | Sale Price | Title Company |
|---|---|---|---|
| Glynn John C | -- | -- | |
| Glynn John C | -- | -- | |
| Linderman Christina Michelle | $12,500 | -- |
Source: Public Records
Tax History Compared to Growth
Tax History
| Year | Tax Paid | Tax Assessment Tax Assessment Total Assessment is a certain percentage of the fair market value that is determined by local assessors to be the total taxable value of land and additions on the property. | Land | Improvement |
|---|---|---|---|---|
| 2025 | $2,125 | $88,476 | $39,900 | $48,576 |
| 2024 | $1,968 | $88,476 | $39,900 | $48,576 |
| 2023 | $1,968 | $81,737 | $35,000 | $46,737 |
| 2022 | $1,822 | $73,848 | $30,660 | $43,188 |
| 2021 | $1,688 | $69,401 | $28,000 | $41,401 |
| 2020 | $1,564 | $68,593 | $27,300 | $41,293 |
| 2019 | $1,466 | $64,833 | $23,800 | $41,033 |
| 2018 | $1,399 | $59,932 | $20,300 | $39,632 |
| 2017 | $1,740 | $60,043 | $19,600 | $40,443 |
| 2016 | $1,310 | $53,891 | $12,950 | $40,941 |
| 2015 | $1,307 | $50,718 | $10,500 | $40,218 |
| 2014 | $1,266 | $42,405 | $10,325 | $32,080 |
Source: Public Records
Map
Nearby Homes
- 1939 Guinn Dr
- 272 Grand Teton Dr
- 1831 Escondido Terrace
- 322 Oliveiro Ct
- 347 Gana Ct Unit B
- 1832 Muchacha Dr
- 1926 Navarre Ln
- 1952 Barranca Dr
- 1809 Nuevo Rd
- 2108 Running River Rd
- 316 Santa Monica Dr
- 1810 Nuevo Rd
- 271 Sunshine Springs Ct
- 327 Fuente Dr
- 259 Spring Hills Ln
- 372 Rushing Creek Ct
- 325 Esquina Dr
- 322 Esquina Dr
- 1795 Nuevo Rd
- 219 Garfield Dr
- 1909 Allen Grove Ct
- 1913 Allen Grove Ct
- 1914 Kransten Dr
- 1907 Allen Grove Ct
- 1912 Kransten Dr
- 1916 Kransten Dr Unit 1
- 1914 Allen Grove Ct
- 1910 Kransten Dr
- 1910 Allen Grove Ct
- 1905 Allen Grove Ct
- 1908 Allen Grove Ct
- 1912 Allen Grove Ct
- 284 Kershner Ct
- 260 Comfort Dr
- 1908 Kransten Dr
- 1906 Allen Grove Ct
- 262 Comfort Dr
- 286 Kershner Ct
- 264 Comfort Dr
- 1903 Allen Grove Ct