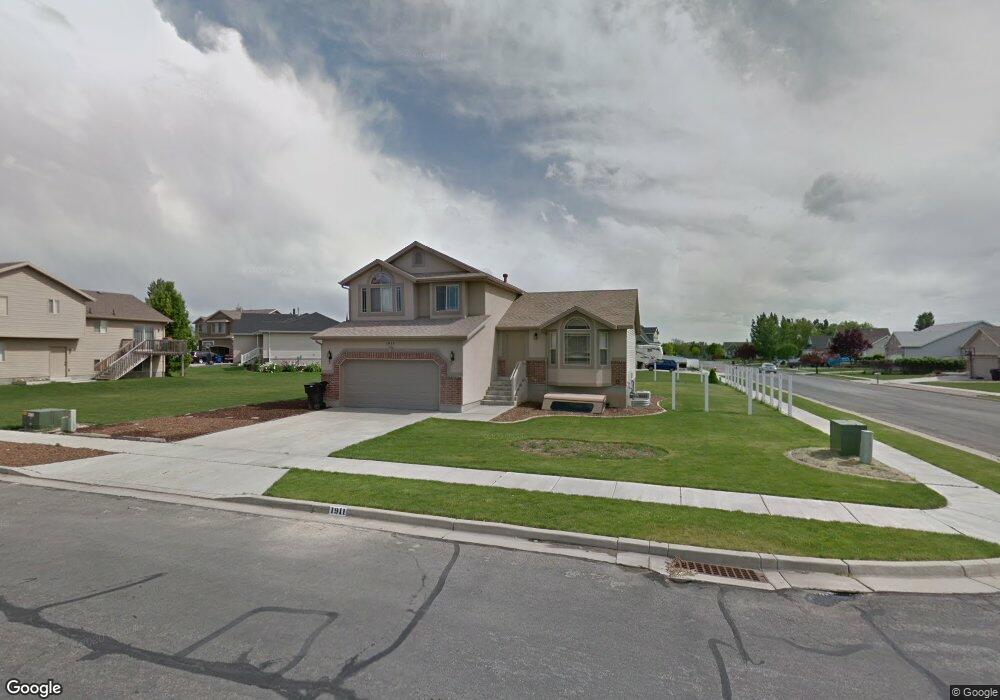
1911 Dallas St Syracuse, UT 84075
Estimated Value: $515,552 - $538,000
4
Beds
3
Baths
2,709
Sq Ft
$194/Sq Ft
Est. Value
About This Home
This home is located at 1911 Dallas St, Syracuse, UT 84075 and is currently estimated at $526,638, approximately $194 per square foot. 1911 Dallas St is a home located in Davis County with nearby schools including Cook School, Syracuse Junior High School, and Syracuse High School.
Ownership History
Date
Name
Owned For
Owner Type
Purchase Details
Closed on
Aug 31, 2023
Sold by
Anderson Darren E and Anderson Kenna L
Bought by
Lal Thara and Lal Ronald Hmung
Current Estimated Value
Home Financials for this Owner
Home Financials are based on the most recent Mortgage that was taken out on this home.
Original Mortgage
$392,000
Outstanding Balance
$383,018
Interest Rate
6.78%
Mortgage Type
New Conventional
Estimated Equity
$143,620
Purchase Details
Closed on
Mar 19, 2007
Sold by
Judy Lance
Bought by
Beck Demar E and Beck Mary N
Purchase Details
Closed on
Aug 17, 2005
Sold by
Dhi Builders Llc
Bought by
Judy Lance
Home Financials for this Owner
Home Financials are based on the most recent Mortgage that was taken out on this home.
Original Mortgage
$20,594
Interest Rate
5.64%
Mortgage Type
Unknown
Create a Home Valuation Report for This Property
The Home Valuation Report is an in-depth analysis detailing your home's value as well as a comparison with similar homes in the area
Home Values in the Area
Average Home Value in this Area
Purchase History
| Date | Buyer | Sale Price | Title Company |
|---|---|---|---|
| Lal Thara | -- | Inwest Title | |
| Beck Demar E | -- | Monument Title Ins Inc | |
| Judy Lance | -- | Equity Title Ins Agency Inc |
Source: Public Records
Mortgage History
| Date | Status | Borrower | Loan Amount |
|---|---|---|---|
| Open | Lal Thara | $392,000 | |
| Previous Owner | Judy Lance | $20,594 | |
| Previous Owner | Judy Lance | $185,349 |
Source: Public Records
Tax History Compared to Growth
Tax History
| Year | Tax Paid | Tax Assessment Tax Assessment Total Assessment is a certain percentage of the fair market value that is determined by local assessors to be the total taxable value of land and additions on the property. | Land | Improvement |
|---|---|---|---|---|
| 2025 | $2,742 | $264,550 | $117,521 | $147,029 |
| 2024 | $2,582 | $250,800 | $96,072 | $154,728 |
| 2023 | $2,418 | $428,000 | $133,929 | $294,071 |
| 2022 | $2,619 | $254,100 | $77,249 | $176,851 |
| 2021 | $2,350 | $353,000 | $114,029 | $238,971 |
| 2020 | $2,097 | $305,000 | $99,897 | $205,103 |
| 2019 | $2,034 | $292,000 | $96,954 | $195,046 |
| 2018 | $1,972 | $281,000 | $94,007 | $186,993 |
| 2016 | $1,637 | $122,321 | $36,108 | $86,213 |
| 2015 | $1,507 | $107,251 | $36,108 | $71,143 |
| 2014 | $1,673 | $121,316 | $36,108 | $85,208 |
| 2013 | -- | $110,393 | $32,985 | $77,408 |
Source: Public Records
Map
Nearby Homes
- 2117 W 1275 S
- 1251 S 1650 W
- 1327 S 1650 W
- 1466 Earl Cir
- 922 S 1760 W
- 916 S 1760 W
- 2655 S 2430 W Unit 120
- 2665 S 2430 W Unit 118
- 2655 S 2430 W Unit 116
- 2633 S 2430 W Unit 113
- 2614 S 2430 W Unit 106
- 2663 S 2430 W
- 1384 S Melanie Ln
- 1481 S Melanie Ln
- 1641 S 2350 W Unit B
- 2050 Craftsman Plan at Legacy Park - Collection
- 2200 Garden Plan at Legacy Park - Collection
- Lincoln Farmhouse Plan at Legacy Park - Estates
- Hamilton Traditional Plan at Legacy Park - Estates
- Tivoli Traditional Plan at Legacy Park - Estates