Estimated Value: $360,323 - $407,000
4
Beds
4
Baths
2,084
Sq Ft
$186/Sq Ft
Est. Value
About This Home
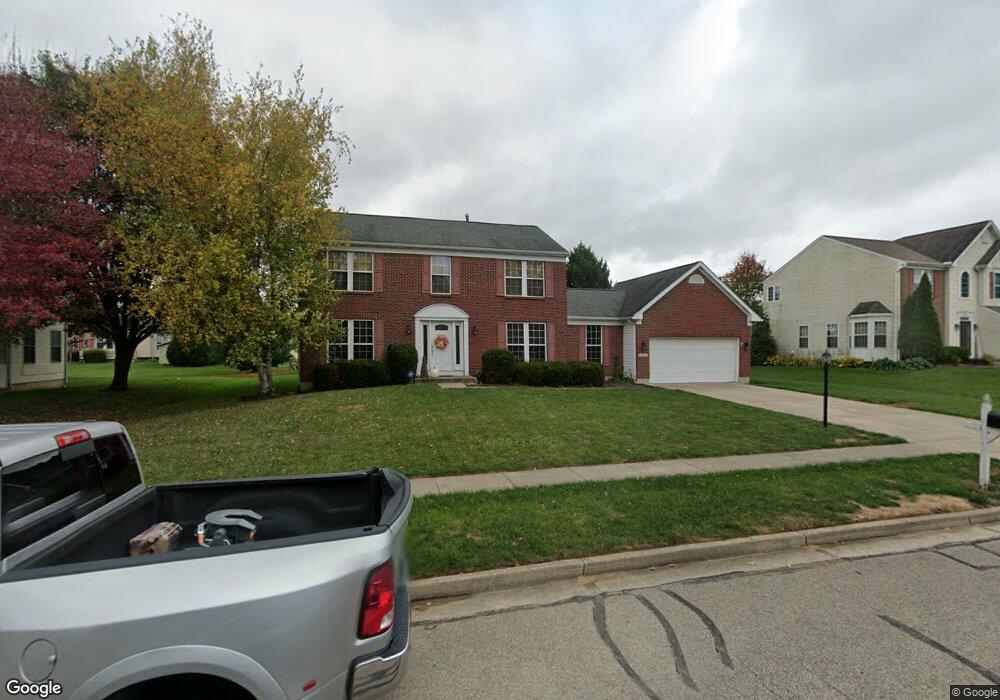
This home is located at 1911 Highlander Dr, Xenia, OH 45385 and is currently estimated at $387,081, approximately $185 per square foot. 1911 Highlander Dr is a home located in Greene County with nearby schools including Xenia High School.
Ownership History
Date
Name
Owned For
Owner Type
Purchase Details
Closed on
Feb 12, 2010
Sold by
Awabdy Nicholas J and Awabdy Nancy L
Bought by
Miller John M and Miller Mary E
Current Estimated Value
Home Financials for this Owner
Home Financials are based on the most recent Mortgage that was taken out on this home.
Original Mortgage
$215,033
Outstanding Balance
$145,621
Interest Rate
5.5%
Mortgage Type
FHA
Estimated Equity
$241,460
Purchase Details
Closed on
Jan 8, 2000
Sold by
Lack Charles R and Lack Tanya D
Bought by
Awabdy Nicholas J and Awabdy Nancy L
Home Financials for this Owner
Home Financials are based on the most recent Mortgage that was taken out on this home.
Original Mortgage
$131,200
Interest Rate
7.84%
Purchase Details
Closed on
Nov 13, 1997
Sold by
Nvr Homes Inc
Bought by
Lack Charles R and Lack D
Home Financials for this Owner
Home Financials are based on the most recent Mortgage that was taken out on this home.
Original Mortgage
$160,550
Interest Rate
6.88%
Mortgage Type
New Conventional
Purchase Details
Closed on
Feb 12, 1997
Bought by
Nvr Homes Inc
Create a Home Valuation Report for This Property
The Home Valuation Report is an in-depth analysis detailing your home's value as well as a comparison with similar homes in the area
Home Values in the Area
Average Home Value in this Area
Purchase History
| Date | Buyer | Sale Price | Title Company |
|---|---|---|---|
| Miller John M | $219,000 | Attorney | |
| Awabdy Nicholas J | $164,000 | -- | |
| Lack Charles R | $179,000 | -- | |
| Nvr Homes Inc | $28,000 | -- |
Source: Public Records
Mortgage History
| Date | Status | Borrower | Loan Amount |
|---|---|---|---|
| Open | Miller John M | $215,033 | |
| Previous Owner | Awabdy Nicholas J | $131,200 | |
| Previous Owner | Lack Charles R | $160,550 |
Source: Public Records
Tax History Compared to Growth
Tax History
| Year | Tax Paid | Tax Assessment Tax Assessment Total Assessment is a certain percentage of the fair market value that is determined by local assessors to be the total taxable value of land and additions on the property. | Land | Improvement |
|---|---|---|---|---|
| 2024 | $4,525 | $105,750 | $17,000 | $88,750 |
| 2023 | $4,525 | $105,750 | $17,000 | $88,750 |
| 2022 | $3,865 | $77,040 | $10,620 | $66,420 |
| 2021 | $3,917 | $77,040 | $10,620 | $66,420 |
| 2020 | $3,753 | $77,040 | $10,620 | $66,420 |
| 2019 | $3,633 | $70,200 | $9,680 | $60,520 |
| 2018 | $3,647 | $70,200 | $9,680 | $60,520 |
| 2017 | $3,542 | $70,200 | $9,680 | $60,520 |
| 2016 | $3,650 | $68,950 | $9,680 | $59,270 |
| 2015 | $3,660 | $68,950 | $9,680 | $59,270 |
| 2014 | $3,505 | $68,950 | $9,680 | $59,270 |
Source: Public Records
Map
Nearby Homes
- 983 Echo Ct
- 460 Kinsey Rd
- 1764 Highlander Dr
- 965 Oak Dale Dr
- 1359 Eagles Way
- 1311 Eagles Way
- 656 Eden Roc Dr
- 15 Sexton Dr
- 610 Saxony Dr
- 513 Redbud Ln
- 508 Marshall Dr
- 1171 N Detroit St
- 1038 Frederick Dr
- 2018 Tahoe Dr
- 0 Mason Rd
- 568 Louise Dr
- 2537 Ridge Rd
- 902 N Detroit St
- 878 N Detroit St
- 479 N Stadium Dr
- 1919 Highlander Dr
- 1903 Highlander Dr
- 1920 Laddie Ct
- 1926 Laddie Ct
- 1927 Highlander Dr
- 1895 Highlander Dr
- 1906 Highlander Dr
- 983 Mound Ct
- 1010 Ashbrooke Ln
- 1932 Laddie Ct
- 1900 Highlander Dr
- 1914 Laddie Ct
- 1018 Ashbrooke Ln
- 1896 Highlander Dr
- 1935 Highlander Dr
- 982 Mound Ct
- Lot 78 Highlander Dr
- 1940 Laddie Ct
- 1026 Ashbrooke Ln
- 1923 Laddie Ct