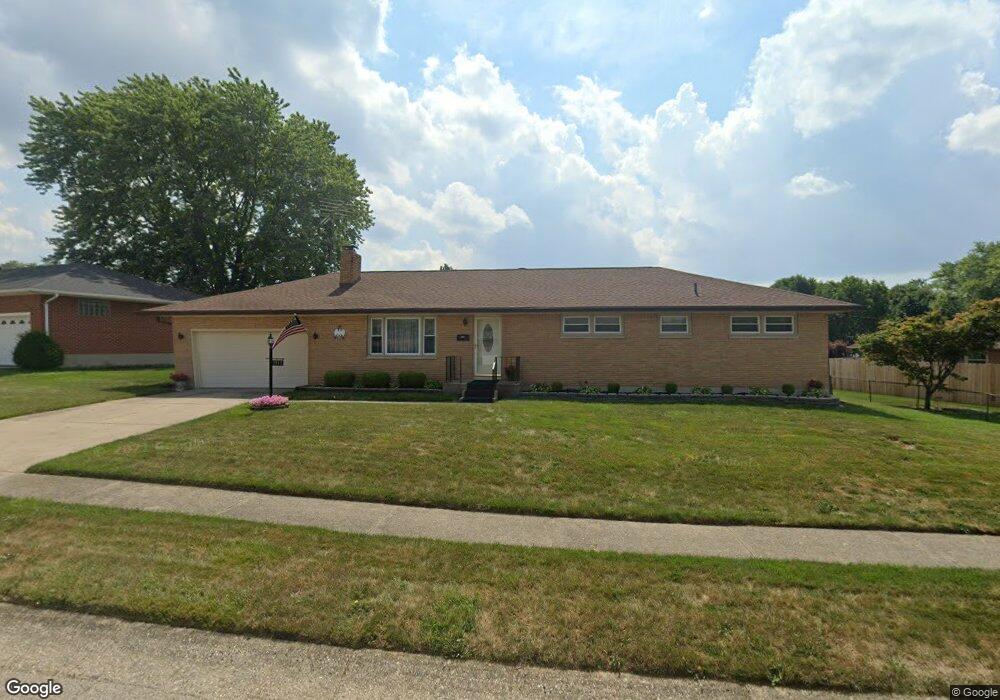
1911 Kimberly Cir Springfield, OH 45503
Estimated Value: $275,000 - $291,239
3
Beds
2
Baths
1,682
Sq Ft
$168/Sq Ft
Est. Value
About This Home
This home is located at 1911 Kimberly Cir, Springfield, OH 45503 and is currently estimated at $282,310, approximately $167 per square foot. 1911 Kimberly Cir is a home located in Clark County with nearby schools including Northridge Elementary School, Kenton Ridge Middle & High School, and Emmanuel Christian Academy.
Ownership History
Date
Name
Owned For
Owner Type
Purchase Details
Closed on
Oct 23, 2009
Sold by
Caldwell Rick C and Caldwell Lisa Rose
Bought by
Caldwell Lisa Rose
Current Estimated Value
Home Financials for this Owner
Home Financials are based on the most recent Mortgage that was taken out on this home.
Original Mortgage
$114,163
Outstanding Balance
$73,596
Interest Rate
5.07%
Mortgage Type
FHA
Estimated Equity
$208,714
Purchase Details
Closed on
Dec 12, 2005
Sold by
Eancheff Van N and Eancheff Rose A
Bought by
Caldwell Rick C and Caldwell Lisa Rose
Home Financials for this Owner
Home Financials are based on the most recent Mortgage that was taken out on this home.
Original Mortgage
$110,761
Interest Rate
6.36%
Mortgage Type
FHA
Purchase Details
Closed on
Jun 22, 1988
Sold by
Harrison Robert D and Harrison Marilyn J
Bought by
Eancheff Van N and Eancheff Rose A
Purchase Details
Closed on
Oct 1, 1981
Create a Home Valuation Report for This Property
The Home Valuation Report is an in-depth analysis detailing your home's value as well as a comparison with similar homes in the area
Home Values in the Area
Average Home Value in this Area
Purchase History
| Date | Buyer | Sale Price | Title Company |
|---|---|---|---|
| Caldwell Lisa Rose | -- | None Available | |
| Caldwell Rick C | $112,500 | -- | |
| Eancheff Van N | $73,000 | -- | |
| -- | $64,900 | -- |
Source: Public Records
Mortgage History
| Date | Status | Borrower | Loan Amount |
|---|---|---|---|
| Open | Caldwell Lisa Rose | $114,163 | |
| Closed | Caldwell Rick C | $110,761 |
Source: Public Records
Tax History
| Year | Tax Paid | Tax Assessment Tax Assessment Total Assessment is a certain percentage of the fair market value that is determined by local assessors to be the total taxable value of land and additions on the property. | Land | Improvement |
|---|---|---|---|---|
| 2025 | $3,308 | $97,280 | $18,350 | $78,930 |
| 2024 | $3,200 | $75,660 | $12,280 | $63,380 |
| 2023 | $3,200 | $75,660 | $12,280 | $63,380 |
| 2022 | $3,211 | $75,660 | $12,280 | $63,380 |
| 2021 | $3,034 | $60,580 | $9,750 | $50,830 |
| 2020 | $3,036 | $60,580 | $9,750 | $50,830 |
| 2019 | $3,094 | $60,580 | $9,750 | $50,830 |
| 2018 | $2,734 | $51,380 | $8,740 | $42,640 |
| 2017 | $2,343 | $55,745 | $8,740 | $47,005 |
| 2016 | $2,327 | $55,745 | $8,740 | $47,005 |
| 2015 | $2,307 | $52,928 | $8,404 | $44,524 |
| 2014 | $2,307 | $52,928 | $8,404 | $44,524 |
| 2013 | $2,253 | $52,928 | $8,404 | $44,524 |
Source: Public Records
Map
Nearby Homes
- 4256 Midfield St Unit 9
- 3969 Covington Dr Unit 3969
- 4446 Ridgewood Rd E Unit 3
- 4028 Ryland Dr Unit 4028
- 4577 Reno Ln Unit 2
- 1831 Pinehurst Dr Unit 37
- 1711 Pinehurst Dr
- 4652 Reno Ln Unit 15
- 1341 Student Ave
- 1503 Kingsgate Rd
- 1505 Kingsgate Rd
- 1507 Kingsgate Rd
- 1500 Kingsgate Rd
- 1502 Kingsgate Rd
- 1500 Kingsgate Rd Unit 19430
- 1502 Kingsgate Rd Unit 19432
- 1509 Kingsgate Rd
- 3631 Kingsgate Ln
- 1201 Kingsgate Rd
- 4500 Bosart Rd
- 1919 Kimberly Cir
- 1840 Montego Dr
- 1906 Montego Dr
- 1927 Kimberly Cir
- 1914 Montego Dr
- 1902 Kimberly Cir
- 1902 Kimberly Cr
- 1916 Kimberly Cir
- 1908 Kimberly Cir
- 1975 Kimberly Cir
- 1922 Kimberly Cir
- 1969 Kimberly Cir
- 1987 Kimberly Cir
- 1951 Kimberly Cir
- 4058 Kimberly Dr
- 1901 Montego Dr
- 1818 Montego Dr
- 1928 Kimberly Cir
- 1909 Montego Dr
- 4134 Phoenix Dr
Your Personal Tour Guide
Ask me questions while you tour the home.