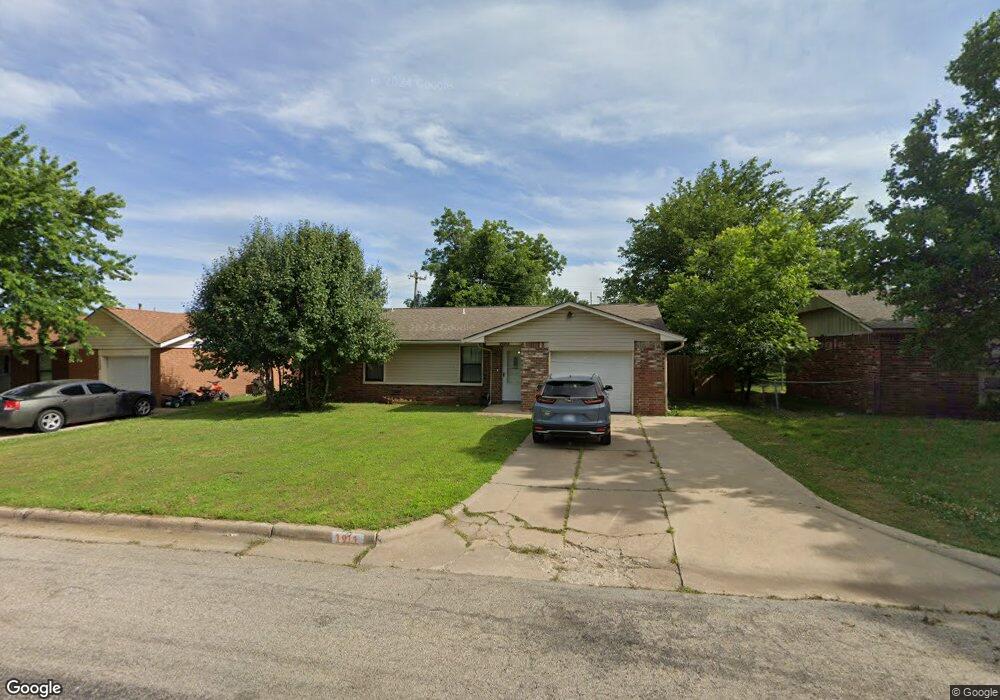
1911 Ridgeway Rd Blackwell, OK 74631
Estimated Value: $86,000 - $112,000
3
Beds
2
Baths
1,171
Sq Ft
$83/Sq Ft
Est. Value
About This Home
This home is located at 1911 Ridgeway Rd, Blackwell, OK 74631 and is currently estimated at $96,977, approximately $82 per square foot. 1911 Ridgeway Rd is a home located in Kay County with nearby schools including Blackwell Elementary School, Blackwell Middle School, and Blackwell High School.
Ownership History
Date
Name
Owned For
Owner Type
Purchase Details
Closed on
Nov 8, 2021
Sold by
Nemer Commercial Properties Llc
Bought by
Turney Blair
Current Estimated Value
Home Financials for this Owner
Home Financials are based on the most recent Mortgage that was taken out on this home.
Original Mortgage
$67,258
Outstanding Balance
$61,536
Interest Rate
2.88%
Mortgage Type
FHA
Estimated Equity
$35,441
Purchase Details
Closed on
Jun 3, 2021
Sold by
Chen Xiu and Lin Bing
Bought by
Nemer Commercial Properties Llc
Home Financials for this Owner
Home Financials are based on the most recent Mortgage that was taken out on this home.
Original Mortgage
$55,200
Interest Rate
2.9%
Mortgage Type
Commercial
Purchase Details
Closed on
Sep 12, 2013
Sold by
Mcbrain Craig W and Mcbrain Tiffany J
Bought by
Chen Xiu and Lin Bing Wen
Purchase Details
Closed on
Dec 20, 2011
Sold by
Housing Authority Of Kaw Tribe Of Indian
Bought by
Mibrain Craig W
Create a Home Valuation Report for This Property
The Home Valuation Report is an in-depth analysis detailing your home's value as well as a comparison with similar homes in the area
Home Values in the Area
Average Home Value in this Area
Purchase History
| Date | Buyer | Sale Price | Title Company |
|---|---|---|---|
| Turney Blair | $68,500 | Security Title Services | |
| Nemer Commercial Properties Llc | $65,000 | Oklahoma City Abstract & Ttl | |
| Chen Xiu | $53,500 | Stewart Escrow & Title | |
| Mibrain Craig W | -- | None Available |
Source: Public Records
Mortgage History
| Date | Status | Borrower | Loan Amount |
|---|---|---|---|
| Open | Turney Blair | $67,258 | |
| Previous Owner | Nemer Commercial Properties Llc | $55,200 |
Source: Public Records
Tax History Compared to Growth
Tax History
| Year | Tax Paid | Tax Assessment Tax Assessment Total Assessment is a certain percentage of the fair market value that is determined by local assessors to be the total taxable value of land and additions on the property. | Land | Improvement |
|---|---|---|---|---|
| 2024 | $880 | $8,308 | $446 | $7,862 |
| 2023 | $880 | $7,912 | $446 | $7,466 |
| 2022 | $694 | $7,536 | $446 | $7,090 |
| 2021 | $543 | $5,797 | $446 | $5,351 |
| 2020 | $542 | $5,797 | $446 | $5,351 |
| 2019 | $533 | $5,639 | $446 | $5,193 |
| 2018 | $532 | $5,797 | $446 | $5,351 |
| 2017 | $561 | $5,894 | $446 | $5,448 |
| 2016 | $553 | $6,050 | $446 | $5,604 |
| 2015 | $537 | $5,886 | $446 | $5,440 |
| 2014 | -- | $5,886 | $446 | $5,440 |
Source: Public Records
Map
Nearby Homes
- 1913 Ridgeway Rd
- 18693-18999 W Ferguson Ave
- 501 S 21st St
- 905 S 13th St
- 1125 S 12th St
- 1013 W College Ave
- 816 W Padon Ave
- 921 W Mckinley Ave
- 1313 W Doolin Ave
- 922 Robin Rd
- 1312 S 8th St
- 521 W College Ave
- 819 S 3rd St
- 410 Legion Dr
- 737 W Doolin Ave
- 323 W Lincoln Ave
- 417 Bel Air Ave
- 715 Parkway Dr
- 115 W Mckinley Ave
- 119 Hill Ave
- 1909 Ridgeway Rd
- 1910 Meadow Ln
- 1907 Ridgeway Rd
- 1912 Meadow Ln
- 1908 Meadow Ln
- 2003 Ridgeway Rd
- 1910 Ridgeway Rd
- 1912 Ridgeway Rd
- 1908 Ridgeway Rd
- 2002 Meadow Ln
- 1906 Meadow Ln
- 1905 Ridgeway Rd
- 2002 Ridgeway Rd
- 1906 Ridgeway Rd
- 1904 Meadow Ln
- 1904 Ridgeway Rd
- 2004 Ridgeway Rd
- 1911 Elmwood Dr
- 2004 Meadow Ln
- 1909 Elmwood Dr