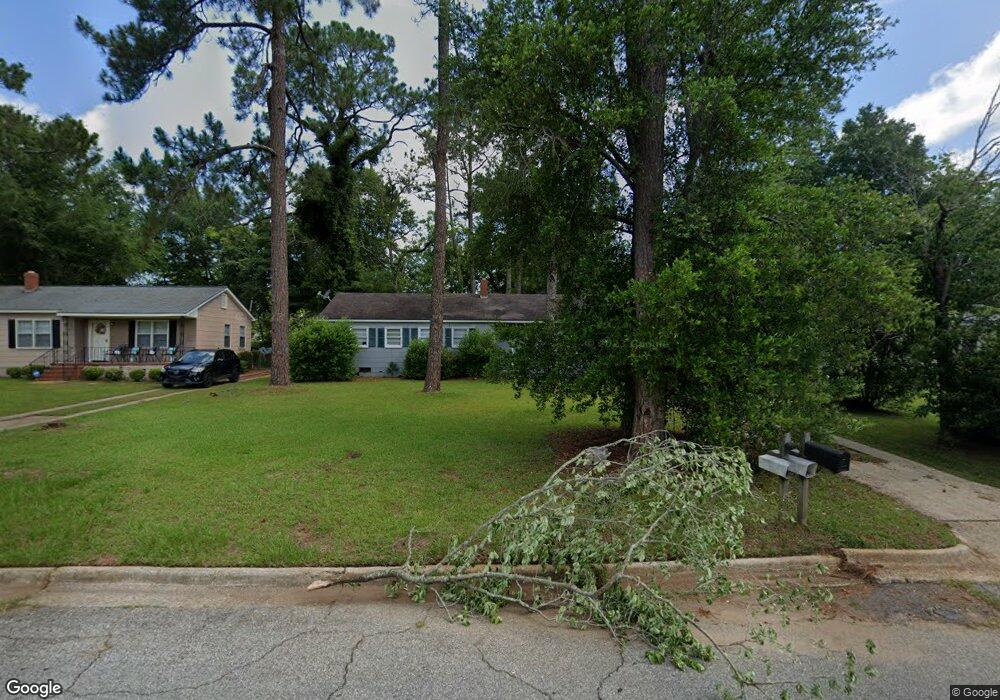
1911 W Highland Ave Albany, GA 31707
Estimated Value: $71,000 - $102,000
3
Beds
1
Bath
1,071
Sq Ft
$77/Sq Ft
Est. Value
About This Home
This home is located at 1911 W Highland Ave, Albany, GA 31707 and is currently estimated at $82,475, approximately $77 per square foot. 1911 W Highland Ave is a home located in Dougherty County with nearby schools including Live Oak Elementary School, Merry Acres Middle School, and Westover High School.
Ownership History
Date
Name
Owned For
Owner Type
Purchase Details
Closed on
Jun 30, 2022
Sold by
Roe Russell W
Bought by
Mesh Properties Llc
Current Estimated Value
Purchase Details
Closed on
Jun 29, 2022
Sold by
Roe Properties Llc
Bought by
Roe Russell W and Roe Teresa C
Purchase Details
Closed on
Mar 7, 2005
Sold by
River Birch Properties
Bought by
River Birch Properties Inc
Purchase Details
Closed on
Mar 5, 2005
Sold by
River Birch Properties Inc
Bought by
Roe Properties Llc
Purchase Details
Closed on
Feb 16, 2000
Sold by
Blackwell David E
Bought by
River Birch Properties
Purchase Details
Closed on
Sep 1, 1998
Sold by
Trans Financial Mtge Co
Bought by
Housing & Urban Dev
Purchase Details
Closed on
Feb 16, 1995
Sold by
Moore J Wendall
Bought by
Schultz Jody D and Schultz Christy B
Purchase Details
Closed on
Jan 7, 1988
Sold by
Phillips Mark and Phillips J
Bought by
Moore Jay Wendell
Create a Home Valuation Report for This Property
The Home Valuation Report is an in-depth analysis detailing your home's value as well as a comparison with similar homes in the area
Home Values in the Area
Average Home Value in this Area
Purchase History
| Date | Buyer | Sale Price | Title Company |
|---|---|---|---|
| Mesh Properties Llc | -- | -- | |
| Roe Russell W | -- | -- | |
| River Birch Properties Inc | -- | -- | |
| Roe Properties Llc | -- | -- | |
| River Birch Properties | $28,000 | -- | |
| Blackwell David E | $28,000 | -- | |
| Housing & Urban Dev | -- | -- | |
| Trans Financial Mtge Co | -- | -- | |
| Schultz Jody D | $41,900 | -- | |
| Moore Jay Wendell | -- | -- |
Source: Public Records
Tax History Compared to Growth
Tax History
| Year | Tax Paid | Tax Assessment Tax Assessment Total Assessment is a certain percentage of the fair market value that is determined by local assessors to be the total taxable value of land and additions on the property. | Land | Improvement |
|---|---|---|---|---|
| 2024 | $899 | $18,840 | $2,960 | $15,880 |
| 2023 | $878 | $18,840 | $2,960 | $15,880 |
| 2022 | $881 | $18,840 | $2,960 | $15,880 |
| 2021 | $817 | $18,840 | $2,960 | $15,880 |
| 2020 | $819 | $18,840 | $2,960 | $15,880 |
| 2019 | $822 | $18,840 | $2,960 | $15,880 |
| 2018 | $825 | $18,840 | $2,960 | $15,880 |
| 2017 | $769 | $18,840 | $2,960 | $15,880 |
| 2016 | $769 | $18,840 | $2,960 | $15,880 |
| 2015 | $771 | $18,840 | $2,960 | $15,880 |
| 2014 | $762 | $18,840 | $2,960 | $15,880 |
Source: Public Records
Map
Nearby Homes
- 1926 W Oglethorpe Ave
- 1916 W Broad Ave
- 100 N Ingleside Dr
- 200 N Ingleside Dr
- 1906 W Whitney Ave
- 1810 Edgerly Ave
- 2009 W Broad Ave
- 410 Endicott Ln
- 1804 W Whitney Ave
- 2021 W Broad Ave
- 501 Endicott Ln
- 400 S Shadowlawn Dr
- 2026 Melrose Dr
- 1821 Samford Ave
- 1703 W Oglethorpe Ave
- 1700 Edgerly Ave
- 1804 W Lincoln Ave
- 1604 W Whitney Ave
- 1714 W Lincoln Ave
- 2013 Jones Ave
- 1913 W Highland Ave
- 1909 W Highland Ave
- 1907 W Highland Ave
- 0 Drexel St
- 1916 W Oglethorpe Ave
- 1910 W Highland Ave
- 1915 W Highland Ave
- 1914 W Oglethorpe Ave
- 1912 W Highland Ave
- 1908 W Highland Ave
- 1905 W Highland Ave
- 1912 W Oglethorpe Ave
- 1906 W Highland Ave
- 213 Drexel St
- 1917 W Highland Ave
- 1914 W Highland Ave
- 1920 W Oglethorpe Ave
- 1903 W Highland Ave
- 1904 W Highland Ave
- 1908 W Oglethorpe Ave