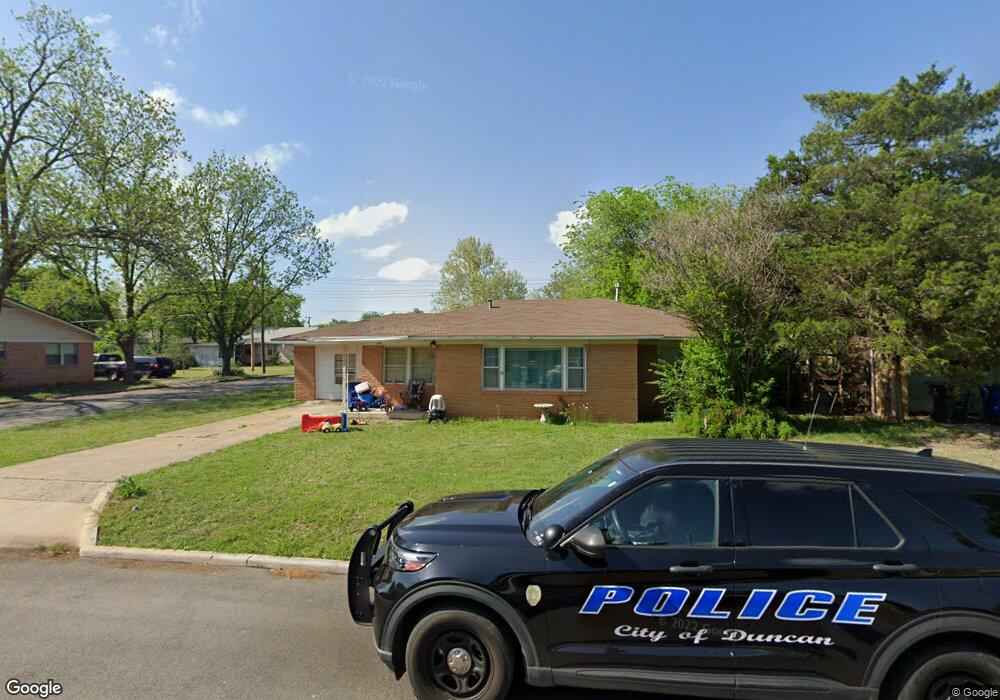
1911 W Walnut Ave Duncan, OK 73533
Estimated Value: $81,000 - $104,000
2
Beds
1
Bath
1,670
Sq Ft
$57/Sq Ft
Est. Value
About This Home
This home is located at 1911 W Walnut Ave, Duncan, OK 73533 and is currently estimated at $94,487, approximately $56 per square foot. 1911 W Walnut Ave is a home located in Stephens County with nearby schools including Mark Twain Elementary School, Duncan Middle School, and Duncan High School.
Ownership History
Date
Name
Owned For
Owner Type
Purchase Details
Closed on
Jul 18, 2013
Sold by
Pope Karen G and Pope Mike
Bought by
Jarrett Weston
Current Estimated Value
Home Financials for this Owner
Home Financials are based on the most recent Mortgage that was taken out on this home.
Original Mortgage
$62,840
Outstanding Balance
$45,214
Interest Rate
3.75%
Mortgage Type
FHA
Estimated Equity
$49,273
Purchase Details
Closed on
Aug 29, 2005
Sold by
Winant Linda L and Winant Ralph M
Bought by
Pope Karen G
Purchase Details
Closed on
Jan 14, 2005
Sold by
Gann Lynn
Bought by
Winant Linda L and Winant Ralph M
Home Financials for this Owner
Home Financials are based on the most recent Mortgage that was taken out on this home.
Original Mortgage
$26,659
Interest Rate
5.68%
Mortgage Type
Purchase Money Mortgage
Purchase Details
Closed on
Nov 12, 1994
Sold by
Gann Fannie B
Create a Home Valuation Report for This Property
The Home Valuation Report is an in-depth analysis detailing your home's value as well as a comparison with similar homes in the area
Home Values in the Area
Average Home Value in this Area
Purchase History
| Date | Buyer | Sale Price | Title Company |
|---|---|---|---|
| Jarrett Weston | $64,000 | None Available | |
| Pope Karen G | $51,000 | None Available | |
| Winant Linda L | $26,000 | None Available | |
| -- | -- | -- |
Source: Public Records
Mortgage History
| Date | Status | Borrower | Loan Amount |
|---|---|---|---|
| Open | Jarrett Weston | $62,840 | |
| Previous Owner | Winant Linda L | $26,659 |
Source: Public Records
Tax History Compared to Growth
Tax History
| Year | Tax Paid | Tax Assessment Tax Assessment Total Assessment is a certain percentage of the fair market value that is determined by local assessors to be the total taxable value of land and additions on the property. | Land | Improvement |
|---|---|---|---|---|
| 2025 | $474 | $5,847 | $612 | $5,235 |
| 2024 | $474 | $5,569 | $612 | $4,957 |
| 2023 | $474 | $5,568 | $612 | $4,956 |
| 2022 | $429 | $5,051 | $612 | $4,439 |
| 2021 | $411 | $4,829 | $612 | $4,217 |
| 2020 | $459 | $5,311 | $612 | $4,699 |
| 2019 | $438 | $5,062 | $612 | $4,450 |
| 2018 | $429 | $5,062 | $612 | $4,450 |
| 2017 | $395 | $4,591 | $612 | $3,979 |
| 2016 | $583 | $6,864 | $612 | $6,252 |
| 2015 | $569 | $6,864 | $612 | $6,252 |
| 2014 | $569 | $7,174 | $550 | $6,624 |
Source: Public Records
Map
Nearby Homes
- 174831 N 2844 Rd
- 2006 W Oak Ave
- 1812 W Walnut Ave
- 2011 2011 W Oak Ave
- 2108 Ave
- 2110 W Main St
- 210 N 22nd St
- 209 N 22nd St
- 201 N 23rd St
- 106 Emery Rd
- 27 N 14th St
- 2210 Western Dr
- 206 N 28th St
- 507 N Alice Dr
- 1309 W Pecan Ave
- 1203 W Walnut Ave
- 0 W Beech Ave
- 1116 1116 W Chestnut
- 210 210 N 31st St
- 2206 2206 W Spruce
- 1909 W Walnut Ave
- 2001 W Walnut Ave
- 1912 W Birch Ave
- 1910 W Birch Ave
- 1912 W Birch Ave
- 1907 W Walnut Ave
- 1912 W Walnut Ave
- 2002 W Birch Ave
- 1910 W Walnut Ave
- 1908 W Birch Ave
- 2003 W Walnut Ave
- 2002 W Walnut Ave
- 1905 1905 W Walnut
- 1905 W Walnut Ave
- 1908 W Walnut Ave
- 2004 W Birch Ave
- 1906 W Birch Ave
- 2004 W Walnut Ave
- 2005 W Walnut Ave
- 1906 W Walnut Ave