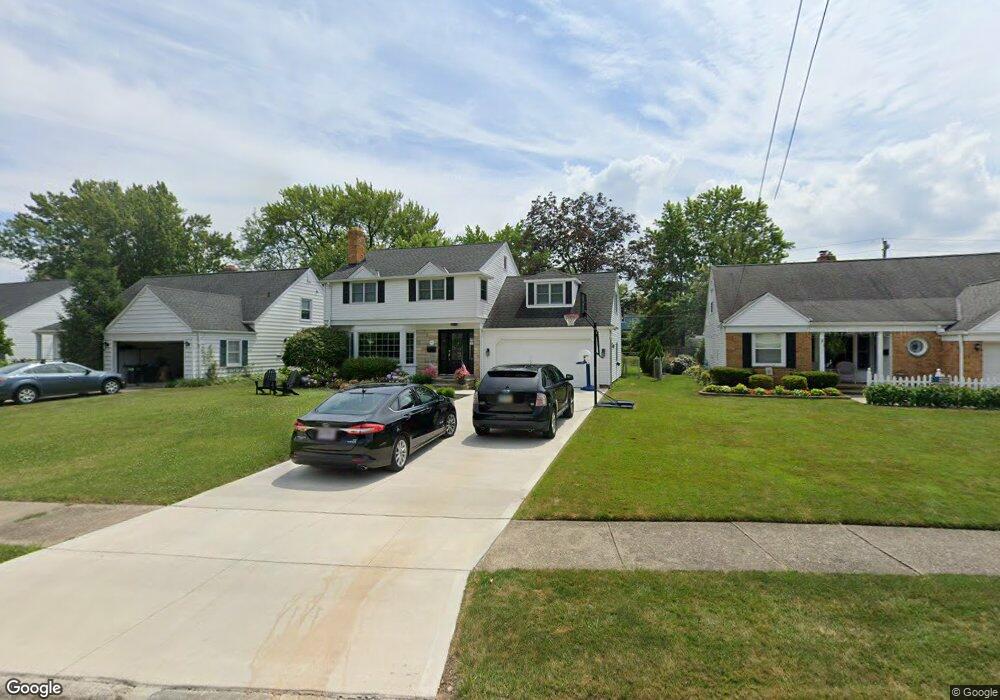
19113 Colahan Dr Rocky River, OH 44116
Estimated Value: $416,000 - $559,000
4
Beds
2
Baths
1,862
Sq Ft
$263/Sq Ft
Est. Value
About This Home
This home is located at 19113 Colahan Dr, Rocky River, OH 44116 and is currently estimated at $490,532, approximately $263 per square foot. 19113 Colahan Dr is a home located in Cuyahoga County with nearby schools including Kensington Intermediate Elementary School, Goldwood Primary Elementary School, and Rocky River Middle School.
Ownership History
Date
Name
Owned For
Owner Type
Purchase Details
Closed on
Jan 10, 2020
Sold by
Barbour Lauren B and Barbour Lyall T
Bought by
Barbour Lyall T and Barbour Lauren B
Current Estimated Value
Purchase Details
Closed on
Aug 2, 2016
Sold by
Mcclain Matthew L
Bought by
Barbour Lauren B
Home Financials for this Owner
Home Financials are based on the most recent Mortgage that was taken out on this home.
Original Mortgage
$244,625
Outstanding Balance
$195,685
Interest Rate
3.56%
Mortgage Type
New Conventional
Estimated Equity
$294,847
Purchase Details
Closed on
Apr 27, 2007
Sold by
Rice Gordon V and Rice Geraldine K
Bought by
Mcclain Matthew L
Purchase Details
Closed on
Jul 21, 1987
Sold by
Rice Gordon V and Rice Geraldine K
Bought by
Rice Gordon
Purchase Details
Closed on
Jan 1, 1975
Bought by
Rice Gordon and Rice Geraldine K
Create a Home Valuation Report for This Property
The Home Valuation Report is an in-depth analysis detailing your home's value as well as a comparison with similar homes in the area
Home Values in the Area
Average Home Value in this Area
Purchase History
| Date | Buyer | Sale Price | Title Company |
|---|---|---|---|
| Barbour Lyall T | -- | Northern Title Agency In | |
| Barbour Lauren B | $257,500 | Northern Title Agency Inc | |
| Mcclain Matthew L | $190,000 | Guardian Title & Guaranty | |
| Rice Gordon | -- | -- | |
| Rice Gordon | -- | -- |
Source: Public Records
Mortgage History
| Date | Status | Borrower | Loan Amount |
|---|---|---|---|
| Open | Barbour Lauren B | $244,625 |
Source: Public Records
Tax History Compared to Growth
Tax History
| Year | Tax Paid | Tax Assessment Tax Assessment Total Assessment is a certain percentage of the fair market value that is determined by local assessors to be the total taxable value of land and additions on the property. | Land | Improvement |
|---|---|---|---|---|
| 2024 | $7,704 | $139,370 | $24,885 | $114,485 |
| 2023 | $7,570 | $113,550 | $25,240 | $88,310 |
| 2022 | $7,517 | $113,540 | $25,240 | $88,310 |
| 2021 | $6,884 | $113,540 | $25,240 | $88,310 |
| 2020 | $6,250 | $90,090 | $20,020 | $70,070 |
| 2019 | $6,142 | $257,400 | $57,200 | $200,200 |
| 2018 | $3,062 | $90,090 | $20,020 | $70,070 |
| 2017 | $5,703 | $76,200 | $16,910 | $59,290 |
| 2016 | $5,552 | $76,200 | $16,910 | $59,290 |
| 2015 | $9,049 | $76,200 | $16,910 | $59,290 |
| 2014 | $5,464 | $68,050 | $15,090 | $52,960 |
Source: Public Records
Map
Nearby Homes
- 19091 Inglewood Ave
- 2159 Wooster Rd Unit 14
- 18950 Rockcliff Dr
- 2039 Wooster Rd Unit D51
- 18820 High Pkwy
- 19575 Shoreland Ave
- 19689 Purnell Ave
- 19712 Laurel Ave
- 18699 High Pkwy
- 18501 Hilliard Blvd Unit A1
- 19960 Westway Dr
- 1744 Lakeview Ave
- 2783 Hampton Rd
- 1422 Gridley St
- 2908 Gasser Blvd
- 2798 Lakeview Ave
- 20333 Detroit Rd Unit 311B
- 20333 Detroit Rd Unit 213B
- 1464 Riverside Dr
- 20309 Marian Ln
- 19129 Colahan Dr
- 19097 Colahan Dr
- 19081 Colahan Dr
- 19145 Colahan Dr
- 19118 Mitchell Ave
- 19102 Mitchell Ave
- 19128 Mitchell Ave
- 19042 Mitchell Ave
- 19065 Colahan Dr
- 19138 Mitchell Ave
- 19112 Colahan Dr
- 19128 Colahan Dr
- 19161 Colahan Dr
- 19036 Mitchell Ave
- 19096 Colahan Dr
- 19146 Mitchell Ave
- 19144 Colahan Dr
- 19080 Colahan Dr
- 19049 Colahan Dr
- 19028 Mitchell Ave