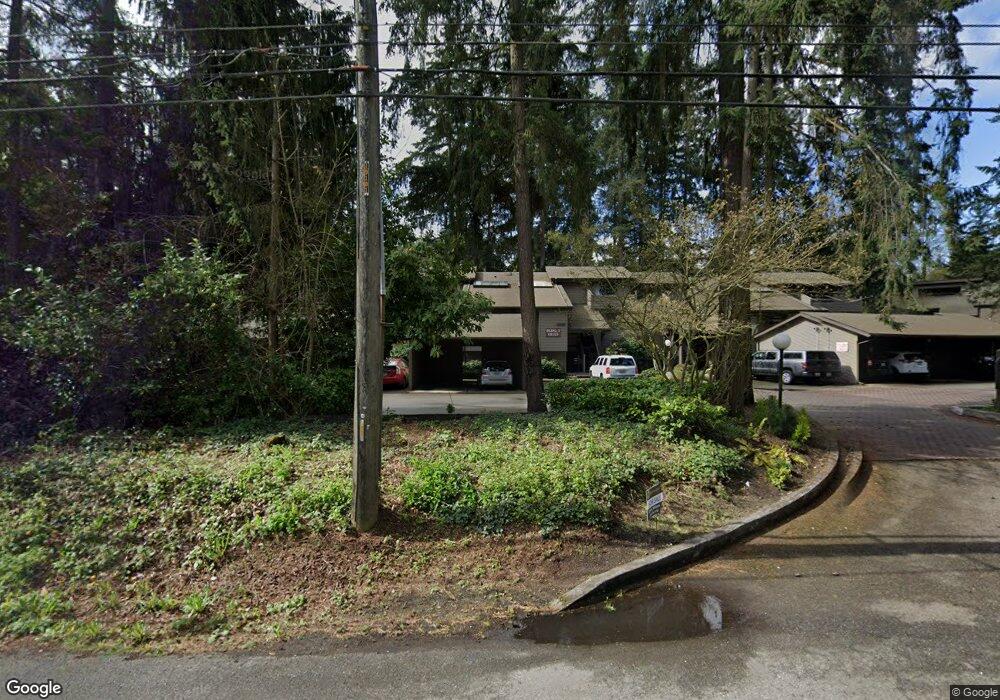
19115 Ballinger Way NE Unit 5103 Lake Forest Park, WA 98155
Brookside NeighborhoodEstimated Value: $383,000 - $420,000
2
Beds
2
Baths
994
Sq Ft
$399/Sq Ft
Est. Value
About This Home
This home is located at 19115 Ballinger Way NE Unit 5103, Lake Forest Park, WA 98155 and is currently estimated at $396,542, approximately $398 per square foot. 19115 Ballinger Way NE Unit 5103 is a home located in King County with nearby schools including Brookside Elementary School, Kellogg Middle School, and Shorecrest High School.
Ownership History
Date
Name
Owned For
Owner Type
Purchase Details
Closed on
Nov 1, 2004
Sold by
Haley Tasha and Garrett Michael
Bought by
Gorham Stephen S
Current Estimated Value
Home Financials for this Owner
Home Financials are based on the most recent Mortgage that was taken out on this home.
Original Mortgage
$151,300
Outstanding Balance
$75,050
Interest Rate
5.69%
Mortgage Type
Purchase Money Mortgage
Estimated Equity
$321,492
Purchase Details
Closed on
Apr 14, 1998
Sold by
Oxley Brett C
Bought by
Garrett Michael and Garrett Tasha
Home Financials for this Owner
Home Financials are based on the most recent Mortgage that was taken out on this home.
Original Mortgage
$110,250
Interest Rate
7.18%
Mortgage Type
FHA
Purchase Details
Closed on
Jul 25, 1997
Sold by
Hill Judith F and Perkins Wade
Bought by
Oxley Brett C
Home Financials for this Owner
Home Financials are based on the most recent Mortgage that was taken out on this home.
Original Mortgage
$82,000
Interest Rate
7.58%
Mortgage Type
FHA
Create a Home Valuation Report for This Property
The Home Valuation Report is an in-depth analysis detailing your home's value as well as a comparison with similar homes in the area
Home Values in the Area
Average Home Value in this Area
Purchase History
| Date | Buyer | Sale Price | Title Company |
|---|---|---|---|
| Gorham Stephen S | $156,000 | Pacific Nw Tit | |
| Garrett Michael | $113,250 | Chicago Title Insurance Co | |
| Oxley Brett C | $102,500 | Chicago Title Ins Co |
Source: Public Records
Mortgage History
| Date | Status | Borrower | Loan Amount |
|---|---|---|---|
| Open | Gorham Stephen S | $151,300 | |
| Previous Owner | Garrett Michael | $110,250 | |
| Previous Owner | Oxley Brett C | $82,000 |
Source: Public Records
Tax History Compared to Growth
Tax History
| Year | Tax Paid | Tax Assessment Tax Assessment Total Assessment is a certain percentage of the fair market value that is determined by local assessors to be the total taxable value of land and additions on the property. | Land | Improvement |
|---|---|---|---|---|
| 2024 | $3,621 | $339,000 | $105,600 | $233,400 |
| 2023 | $2,936 | $353,000 | $83,600 | $269,400 |
| 2022 | $3,192 | $286,000 | $79,200 | $206,800 |
| 2021 | $3,285 | $273,000 | $77,000 | $196,000 |
| 2020 | $3,408 | $257,000 | $77,000 | $180,000 |
| 2018 | $2,526 | $264,000 | $68,200 | $195,800 |
| 2017 | $1,930 | $201,000 | $68,200 | $132,800 |
| 2016 | $1,715 | $154,000 | $66,000 | $88,000 |
| 2015 | $1,966 | $128,000 | $59,400 | $68,600 |
| 2014 | -- | $143,000 | $59,400 | $83,600 |
| 2013 | -- | $118,000 | $55,000 | $63,000 |
Source: Public Records
Map
Nearby Homes
- 19119 Ballinger Way NE Unit 204
- 19123 Ballinger Way NE Unit 304
- 185 xx 24th Place NE
- 19230 Forest Park Dr NE Unit K335
- 19230 Forest Park Dr NE Unit H126
- 19230 Forest Park Dr NE Unit J131
- 19044 35th Ave NE
- 18011 2nd Ave NE Unit B
- 3513 NE 187th Ct
- 194 Xx Forest Park Dr NE
- 19331 37th Ave NE
- 19415 36th Ct NE
- 19851 25th Ave NE Unit 204
- 19855 25th Ave NE Unit 206
- 2224 NE 197th Place
- 1823 NE 185th St
- 2482 NE 183rd Ln
- 1518 NE 195th St
- 18800 15th Ave NE
- 17904 23rd Ln NE Unit 301
- 19119 Ballinger Way NE Unit 103
- 19119 Ballinger Way NE Unit 102
- 19115 Ballinger Way NE
- 19119 Ballinger Way NE Unit 201
- 19115 Ballinger Way NE Unit 201
- 19115 Ballinger Way NE Unit 2102
- 19115 Ballinger Way NE Unit 6101
- 19115 Ballinger Way NE Unit 6202
- 19115 Ballinger Way NE Unit 6201
- 19115 Ballinger Way NE Unit 6102
- 19115 Ballinger Way NE Unit 5202
- 19115 Ballinger Way NE Unit 5204
- 19115 Ballinger Way NE Unit 203
- 19115 Ballinger Way NE Unit 202
- 19115 Ballinger Way NE Unit 201
- 19115 Ballinger Way NE Unit 2104
- 19115 Ballinger Way NE Unit 5104
- 19115 Ballinger Way NE Unit 5102
- 19115 Ballinger Way NE Unit 5101
- 19115 Ballinger Way NE Unit 4104