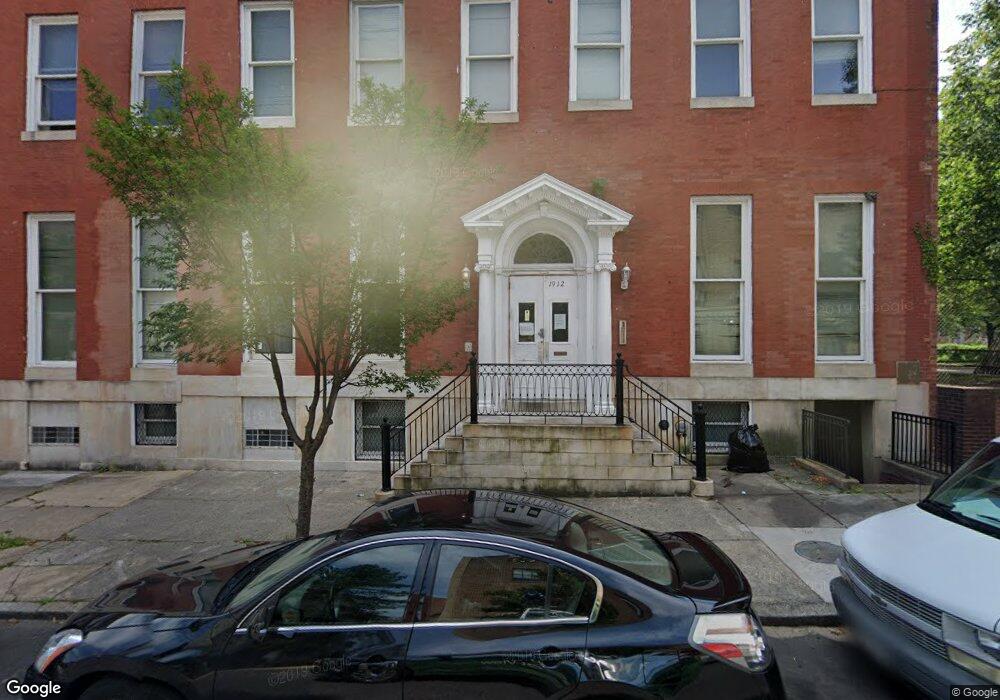
1912 Madison Ave Unit 403 Baltimore, MD 21217
Madison Park NeighborhoodEstimated Value: $171,769 - $186,000
3
Beds
2
Baths
1,308
Sq Ft
$137/Sq Ft
Est. Value
About This Home
This home is located at 1912 Madison Ave Unit 403, Baltimore, MD 21217 and is currently estimated at $178,885, approximately $136 per square foot. 1912 Madison Ave Unit 403 is a home located in Baltimore City with nearby schools including Mount Royal Elementary/Middle School, Booker T. Washington Middle School, and Frederick Douglass High School.
Ownership History
Date
Name
Owned For
Owner Type
Purchase Details
Closed on
Feb 7, 2017
Sold by
Allegheny East Corporation Inc
Bought by
Allegheny East Conference Corporation Of
Current Estimated Value
Purchase Details
Closed on
Feb 2, 2017
Sold by
Sullivan Laura H G O
Bought by
Allegheny East Corporation Inc
Purchase Details
Closed on
Sep 10, 2011
Sold by
2027 Madison Llc
Bought by
Adams Hattie
Home Financials for this Owner
Home Financials are based on the most recent Mortgage that was taken out on this home.
Original Mortgage
$156,600
Interest Rate
6.06%
Mortgage Type
New Conventional
Purchase Details
Closed on
Sep 19, 2007
Sold by
Rogers Betty J
Bought by
2027 Madison Llc
Purchase Details
Closed on
Feb 28, 1996
Sold by
Dorchester Group Inc The
Bought by
Rogers Betty J and Rogers Conswilla
Create a Home Valuation Report for This Property
The Home Valuation Report is an in-depth analysis detailing your home's value as well as a comparison with similar homes in the area
Home Values in the Area
Average Home Value in this Area
Purchase History
| Date | Buyer | Sale Price | Title Company |
|---|---|---|---|
| Allegheny East Conference Corporation Of | $5,000 | King Title Co Inc | |
| Allegheny East Corporation Inc | $5,000 | King Title Co Inc | |
| Adams Hattie | $174,000 | -- | |
| Adams Hattie | $174,000 | -- | |
| 2027 Madison Llc | $65,000 | -- | |
| Rogers Betty J | $72,000 | -- |
Source: Public Records
Mortgage History
| Date | Status | Borrower | Loan Amount |
|---|---|---|---|
| Previous Owner | Adams Hattie | $156,600 |
Source: Public Records
Tax History Compared to Growth
Tax History
| Year | Tax Paid | Tax Assessment Tax Assessment Total Assessment is a certain percentage of the fair market value that is determined by local assessors to be the total taxable value of land and additions on the property. | Land | Improvement |
|---|---|---|---|---|
| 2025 | $1,212 | $55,300 | $13,800 | $41,500 |
| 2024 | $1,212 | $51,600 | $0 | $0 |
| 2023 | $1,125 | $47,900 | $0 | $0 |
| 2022 | $1,043 | $44,200 | $11,000 | $33,200 |
| 2021 | $1,043 | $44,200 | $11,000 | $33,200 |
| 2020 | $1,043 | $44,200 | $11,000 | $33,200 |
| 2019 | $1,038 | $44,200 | $11,000 | $33,200 |
| 2018 | $1,043 | $44,200 | $11,000 | $33,200 |
| 2017 | $1,175 | $49,800 | $0 | $0 |
| 2016 | -- | $55,000 | $0 | $0 |
| 2015 | $1,303 | $55,000 | $0 | $0 |
| 2014 | $1,303 | $55,000 | $0 | $0 |
Source: Public Records
Map
Nearby Homes
- 1906 Madison Ave
- 1917 Mcculloh St
- 1908 Mcculloh St
- 1816 Mcculloh St
- 1812 Mcculloh St
- 1905 Druid Hill Ave
- 1827 Druid Hill Ave
- 1736 Mcculloh St
- 1722 Mcculloh St
- 339 Bloom St
- 1910 Druid Hill Ave
- 1726 Linden Ave
- 1916 Druid Hill Ave
- 1718 Druid Hill Ave
- 509 Laurens St
- 2103 Mcculloh St
- 2026 Druid Hill Ave
- 532 Laurens St
- 2115 Mcculloh St
- 2106 Mcculloh St
- 1912 Madison Ave Unit 202
- 1912 Madison Ave Unit 401
- 1912 Madison Ave Unit 101
- 1912 Madison Ave Unit 201
- 1912 Madison Ave Unit 102
- 1912 Madison Ave Unit 303
- 1912 Madison Ave Unit 402
- 1912 Madison Ave Unit 203
- 1912 Madison Ave Unit 302
- 1912 Madison Ave Unit 301
- 1912 Madison Ave Unit 103
- 1910 Madison Ave
- 1908 Madison Ave
- 1904 Madison Ave
- 1902 Madison Ave
- 1900 Madison Ave
- 1900 Madison Ave Unit 2
- 1911 Mcculloh St
- 1907 Mcculloh St
- 1920 Madison Ave