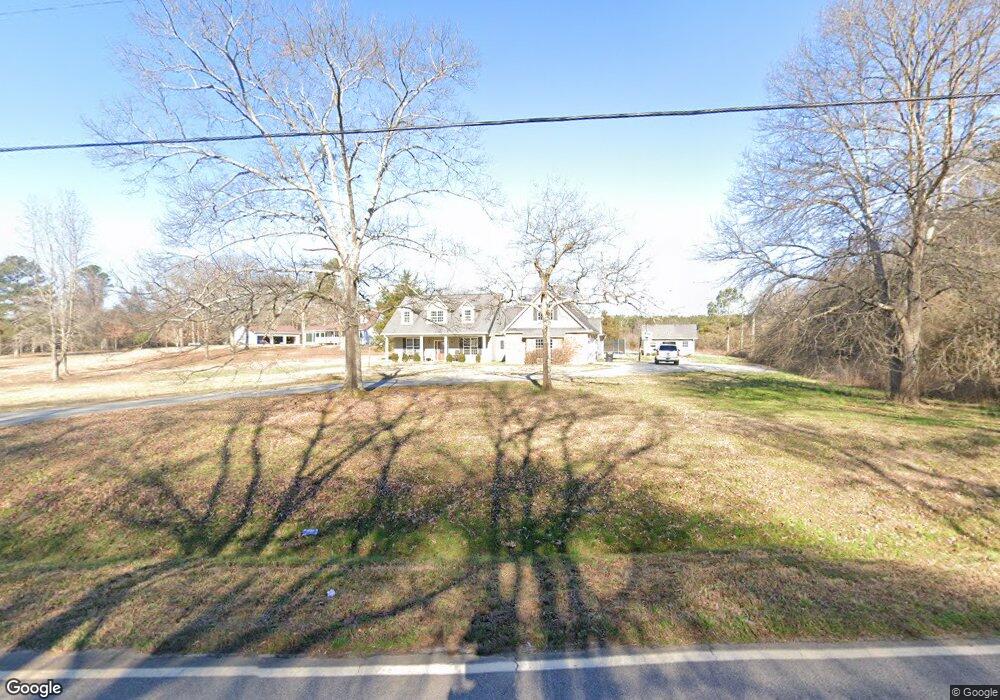
1912 N Fairview Rd Unit LOT Lavonia, GA 30553
Estimated Value: $324,000 - $547,000
4
Beds
2
Baths
2,400
Sq Ft
$166/Sq Ft
Est. Value
About This Home
This home is located at 1912 N Fairview Rd Unit LOT, Lavonia, GA 30553 and is currently estimated at $397,384, approximately $165 per square foot. 1912 N Fairview Rd Unit LOT is a home located in Franklin County with nearby schools including Franklin County High School.
Ownership History
Date
Name
Owned For
Owner Type
Purchase Details
Closed on
Jul 29, 2013
Sold by
Sec Of Housing & U
Bought by
Burks Michelle Carson
Current Estimated Value
Home Financials for this Owner
Home Financials are based on the most recent Mortgage that was taken out on this home.
Original Mortgage
$172,873
Outstanding Balance
$128,457
Interest Rate
4.37%
Mortgage Type
FHA
Estimated Equity
$268,927
Purchase Details
Closed on
Feb 5, 2013
Sold by
Seaside National Bank & Tr
Bought by
Sec Of Housing & Urban
Purchase Details
Closed on
Apr 17, 2006
Sold by
Terrell Karen D
Bought by
Coker William D
Home Financials for this Owner
Home Financials are based on the most recent Mortgage that was taken out on this home.
Original Mortgage
$216,000
Interest Rate
6.31%
Mortgage Type
New Conventional
Purchase Details
Closed on
Oct 25, 2005
Sold by
Coker Mickey Thomas
Bought by
Coker William D
Purchase Details
Closed on
May 14, 2001
Sold by
Terrell Russell
Bought by
Coker Mickey Thomas
Create a Home Valuation Report for This Property
The Home Valuation Report is an in-depth analysis detailing your home's value as well as a comparison with similar homes in the area
Home Values in the Area
Average Home Value in this Area
Purchase History
| Date | Buyer | Sale Price | Title Company |
|---|---|---|---|
| Burks Michelle Carson | $170,000 | -- | |
| Sec Of Housing & Urban | $285,585 | -- | |
| Seaside National Bank & Trust | $285,585 | -- | |
| Coker William D | -- | -- | |
| Coker William D | $6,246 | -- | |
| Coker Mickey Thomas | $8,700 | -- |
Source: Public Records
Mortgage History
| Date | Status | Borrower | Loan Amount |
|---|---|---|---|
| Open | Burks Michelle Carson | $172,873 | |
| Previous Owner | Coker William D | $216,000 | |
| Closed | Coker William D | $0 |
Source: Public Records
Tax History Compared to Growth
Tax History
| Year | Tax Paid | Tax Assessment Tax Assessment Total Assessment is a certain percentage of the fair market value that is determined by local assessors to be the total taxable value of land and additions on the property. | Land | Improvement |
|---|---|---|---|---|
| 2024 | $2,348 | $100,660 | $3,082 | $97,578 |
| 2023 | $2,311 | $91,578 | $2,802 | $88,776 |
| 2022 | $2,090 | $83,002 | $2,173 | $80,829 |
| 2021 | $1,985 | $74,141 | $2,173 | $71,968 |
| 2020 | $2,006 | $74,141 | $2,173 | $71,968 |
| 2019 | $1,938 | $74,141 | $2,173 | $71,968 |
| 2018 | $1,692 | $65,001 | $2,791 | $62,210 |
| 2017 | $1,760 | $65,001 | $2,791 | $62,210 |
| 2016 | $1,632 | $57,925 | $2,791 | $55,134 |
| 2015 | -- | $57,924 | $2,791 | $55,134 |
| 2014 | -- | $57,924 | $2,791 | $55,134 |
| 2013 | -- | $53,246 | $2,790 | $50,455 |
Source: Public Records
Map
Nearby Homes
- 0 Fairview Farms Unit 7680882
- 0 Fairview Farms Unit 10623287
- 40 Sewell Rd
- 62 Sewell Rd
- 86 Sewell
- 152 Sewell Rd
- 807 Sewell Rd
- 308 Idle Acres Ln
- 450 N Clarks Creek Rd
- 103 Ross Place
- 16834 Georgia 17
- 396 Brookwood Dr
- 919 Pleasant Hill Cir
- 159 Old Park Rd
- 1057 Pleasant Hill Cir
- 0 Highway 59 Unit 10615036
- 0 Highway 59 Unit 10632364
- 5474 Vickery St
- 5494 Vickery St
- 5710 Vickery St
- 1912 N Fairview Rd
- 1982 N Fairview Rd
- 1907 N Fairview Rd
- 1895 N Fairview Rd
- 1977 N Fairview Rd
- 461 Wilson Cir
- 0 Whiting Rd
- 0 Whiting Rd Unit 7025425
- 0 Whiting Rd Unit 7025421
- 0 Whiting Rd Unit 3139781
- 0 Whiting Rd Unit 6697761
- 0 Whiting Rd Unit 8755828
- 2040 N Fairview Rd
- 472 Wilson Cir
- 2044 N Fairview Rd
- 1745 N Fairview Rd
- 1723 N Fairview Rd
- 422 Wilson Cir
- 351 Wilson Cir
- 258 Whiting Rd