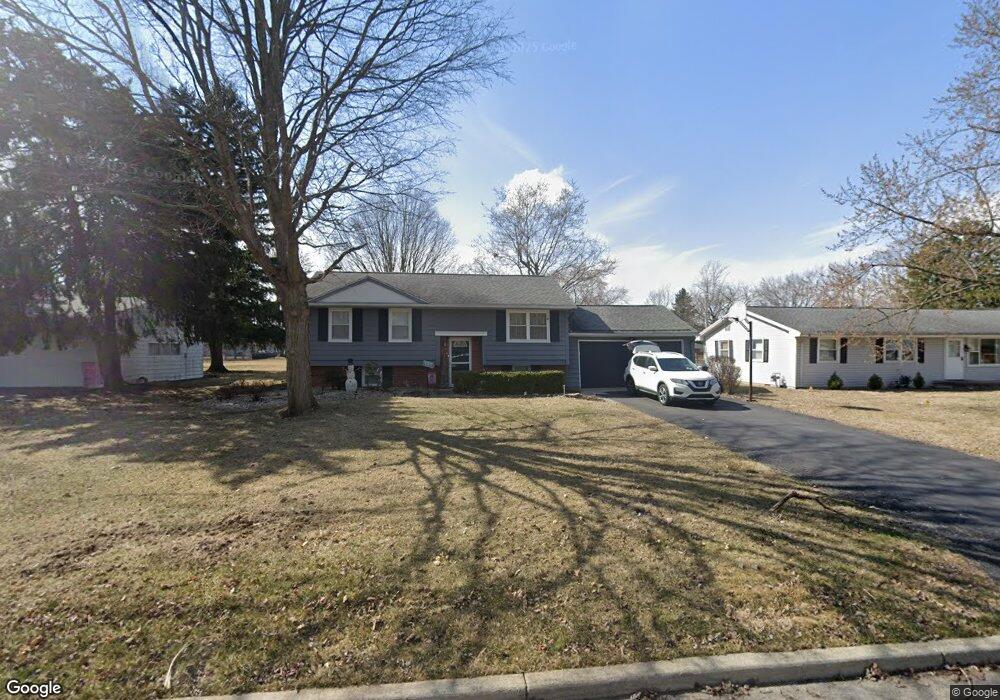
1912 Westview Dr Findlay, OH 45840
Estimated Value: $233,000 - $250,000
3
Beds
2
Baths
2,012
Sq Ft
$119/Sq Ft
Est. Value
About This Home
This home is located at 1912 Westview Dr, Findlay, OH 45840 and is currently estimated at $239,120, approximately $118 per square foot. 1912 Westview Dr is a home located in Hancock County with nearby schools including Jefferson Elementary School, Chamberlin Hill Elementary School, and Donnell Middle School.
Ownership History
Date
Name
Owned For
Owner Type
Purchase Details
Closed on
May 7, 2002
Sold by
Gatchell Brenda J
Bought by
Spitler Todd W and Spitler Denise M
Current Estimated Value
Home Financials for this Owner
Home Financials are based on the most recent Mortgage that was taken out on this home.
Original Mortgage
$86,800
Outstanding Balance
$37,296
Interest Rate
7.18%
Mortgage Type
New Conventional
Estimated Equity
$201,824
Purchase Details
Closed on
May 27, 1999
Sold by
Hipsher Leah
Bought by
Gatchell Wayne and Gatchell Brenda
Home Financials for this Owner
Home Financials are based on the most recent Mortgage that was taken out on this home.
Original Mortgage
$91,600
Interest Rate
6.92%
Mortgage Type
New Conventional
Purchase Details
Closed on
Nov 16, 1998
Sold by
Hipsher Jay
Bought by
Hipsher Leah
Purchase Details
Closed on
Apr 28, 1993
Bought by
Hipsher Jay A & Laura L
Create a Home Valuation Report for This Property
The Home Valuation Report is an in-depth analysis detailing your home's value as well as a comparison with similar homes in the area
Home Values in the Area
Average Home Value in this Area
Purchase History
| Date | Buyer | Sale Price | Title Company |
|---|---|---|---|
| Spitler Todd W | $108,500 | -- | |
| Gatchell Wayne | $114,500 | -- | |
| Hipsher Leah | $120,000 | -- | |
| Hipsher Jay A & Laura L | -- | -- |
Source: Public Records
Mortgage History
| Date | Status | Borrower | Loan Amount |
|---|---|---|---|
| Open | Spitler Todd W | $86,800 | |
| Previous Owner | Gatchell Wayne | $91,600 |
Source: Public Records
Tax History
| Year | Tax Paid | Tax Assessment Tax Assessment Total Assessment is a certain percentage of the fair market value that is determined by local assessors to be the total taxable value of land and additions on the property. | Land | Improvement |
|---|---|---|---|---|
| 2024 | $2,001 | $56,330 | $7,680 | $48,650 |
| 2023 | $2,004 | $56,330 | $7,680 | $48,650 |
| 2022 | $1,997 | $56,330 | $7,680 | $48,650 |
| 2021 | $1,753 | $43,060 | $7,680 | $35,380 |
| 2020 | $1,752 | $43,060 | $7,680 | $35,380 |
| 2019 | $1,717 | $43,060 | $7,680 | $35,380 |
| 2018 | $1,673 | $38,450 | $7,680 | $30,770 |
| 2017 | $836 | $38,450 | $7,680 | $30,770 |
| 2016 | $1,652 | $38,450 | $7,680 | $30,770 |
| 2015 | $1,306 | $29,870 | $8,960 | $20,910 |
| 2014 | $1,306 | $29,870 | $8,960 | $20,910 |
| 2012 | $1,866 | $42,340 | $8,960 | $33,380 |
Source: Public Records
Map
Nearby Homes
- 1726 Eastview Dr
- 1709 Eastview Dr
- 731 5th St
- 1100 Stall Dr
- 0 Township Road 227
- 242 E Yates Ave
- 331 Fairlawn Place
- 0 Blanchard Ave
- 209 E Hobart Ave
- 225 E Yates Ave
- 315 Fairlawn Place
- 136 E Hobart Ave
- 206 Greenlawn Ave
- 1037 Fishlock Ave
- 1200 1st St
- 123 Glendale Ave
- 1304 Douglas Pkwy
- 15591 Canadian Way
- 15586 Canadian Way
- 15615 Canadian Way
- 1906 Westview Dr
- 1920 Westview Dr
- 1900 Westview Dr
- 2000 Westview Dr
- 1915 Brookside Dr
- 1907 Brookside Dr
- 1921 Brookside Dr
- 1905 Westview Dr
- 2008 Westview Dr
- 1903 Westview Dr
- 1921 Westview Dr
- 1901 Brookside Dr
- 2001 Brookside Dr
- 1901 Westview Dr
- 1830 Westview Dr
- 2010 Westview Dr
- 2009 Brookside Dr
- 2009 Westview Dr
- 1833 Brookside Dr
- 1833 Westview Dr
Your Personal Tour Guide
Ask me questions while you tour the home.