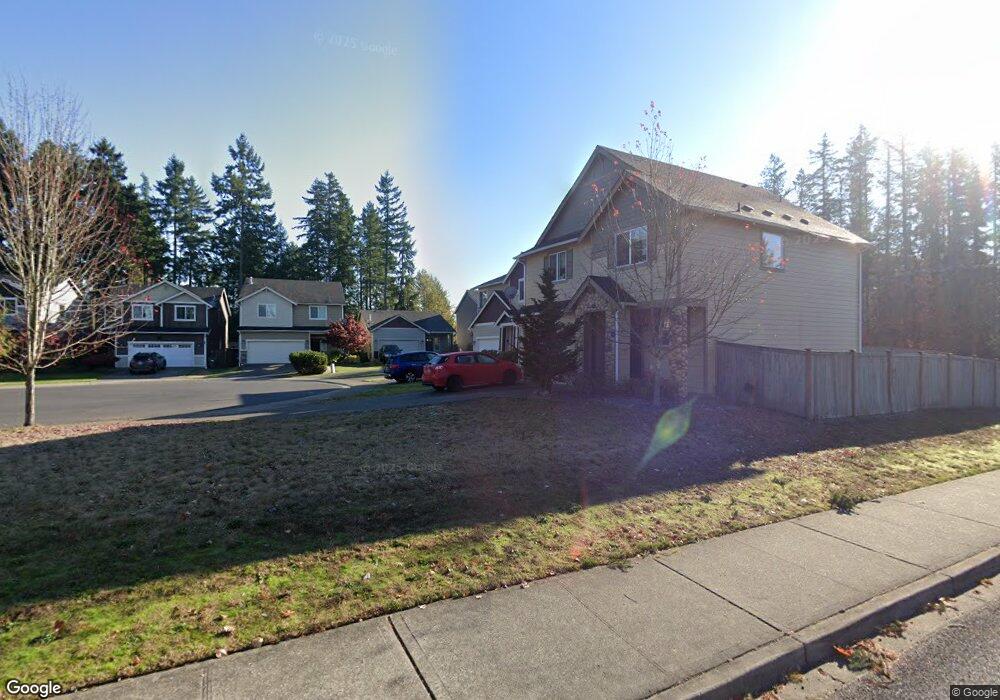
19123 87th Avenue Ct E Puyallup, WA 98375
Estimated Value: $569,922 - $606,000
4
Beds
3
Baths
2,144
Sq Ft
$275/Sq Ft
Est. Value
About This Home
This home is located at 19123 87th Avenue Ct E, Puyallup, WA 98375 and is currently estimated at $590,481, approximately $275 per square foot. 19123 87th Avenue Ct E is a home located in Pierce County with nearby schools including Emma L. Carson Elementary School, Stahl Junior High, and Gov. John Rogers High School.
Ownership History
Date
Name
Owned For
Owner Type
Purchase Details
Closed on
Dec 21, 2010
Sold by
Sdc Homes Llc
Bought by
Reyes Barbara M and Napier Robert W
Current Estimated Value
Home Financials for this Owner
Home Financials are based on the most recent Mortgage that was taken out on this home.
Original Mortgage
$254,404
Outstanding Balance
$167,652
Interest Rate
4.17%
Mortgage Type
New Conventional
Estimated Equity
$422,830
Purchase Details
Closed on
Sep 1, 2010
Sold by
First Citizens Bank & Trust Company
Bought by
Rti Llc
Purchase Details
Closed on
Mar 17, 2010
Sold by
Federal Deposit Insurance Corporation
Bought by
First Citizens Bank & Trust
Purchase Details
Closed on
Jan 26, 2009
Sold by
Regent Homes Inc
Bought by
Venture Bank
Purchase Details
Closed on
May 24, 2006
Sold by
Southridge Silver Creek Llc
Bought by
Regent Homes Inc
Home Financials for this Owner
Home Financials are based on the most recent Mortgage that was taken out on this home.
Original Mortgage
$6,316,740
Interest Rate
6.52%
Mortgage Type
Construction
Create a Home Valuation Report for This Property
The Home Valuation Report is an in-depth analysis detailing your home's value as well as a comparison with similar homes in the area
Home Values in the Area
Average Home Value in this Area
Purchase History
| Date | Buyer | Sale Price | Title Company |
|---|---|---|---|
| Reyes Barbara M | $245,501 | Ticor | |
| Rti Llc | $150,000 | Ticor | |
| First Citizens Bank & Trust | -- | Accommodation | |
| Venture Bank | -- | None Available | |
| Regent Homes Inc | $9,817,500 | Stewart Title |
Source: Public Records
Mortgage History
| Date | Status | Borrower | Loan Amount |
|---|---|---|---|
| Open | Reyes Barbara M | $254,404 | |
| Previous Owner | Regent Homes Inc | $6,316,740 |
Source: Public Records
Tax History Compared to Growth
Tax History
| Year | Tax Paid | Tax Assessment Tax Assessment Total Assessment is a certain percentage of the fair market value that is determined by local assessors to be the total taxable value of land and additions on the property. | Land | Improvement |
|---|---|---|---|---|
| 2025 | $4,987 | $522,000 | $192,100 | $329,900 |
| 2024 | $4,987 | $500,700 | $185,200 | $315,500 |
| 2023 | $4,987 | $477,600 | $185,200 | $292,400 |
| 2022 | $4,641 | $506,200 | $189,300 | $316,900 |
| 2021 | $4,783 | $367,500 | $139,500 | $228,000 |
| 2019 | $4,424 | $352,600 | $121,600 | $231,000 |
| 2018 | $4,214 | $326,400 | $103,700 | $222,700 |
| 2017 | $4,060 | $290,700 | $90,100 | $200,600 |
| 2016 | $3,577 | $250,000 | $68,000 | $182,000 |
| 2014 | $3,201 | $223,100 | $50,900 | $172,200 |
| 2013 | $3,201 | $204,500 | $44,100 | $160,400 |
Source: Public Records
Map
Nearby Homes
- 19117 87th Avenue Ct E
- 19121 87th Avenue Ct E
- 19018 89th Ave E
- 8713 188th Street Ct E
- 19011 89th Ave E
- 18824 Silver Creek Ave E
- 8214 191st St E
- 13449 192nd St E
- 8524 186th Street Ct E
- 9107 189th St E
- 18506 86th Avenue Ct E
- 8715 185th Street Ct E
- 8701 198th St E
- 9201 188th St E
- 9426 187th Street Ct E
- 9211 188th St E
- 8102 195th St E Unit 95
- 9409 190th St E
- 8108 185th Street Ct E
- 18424 83rd Ave E
- 19125 87th Avenue Ct E
- 19129 87th Avenue Ct E
- 19113 87th Avenue Ct E
- 19109 87th Avenue Ct E
- 8620 192nd St E
- 13457 192nd St E Unit 209
- 13449 192nd St E Unit 207
- 13453 192nd St E Unit 208
- 13456 192nd St E Unit 210
- 19105 87th Avenue Ct E
- 19101 87th Avenue Ct E
- 19109 85th Avenue Ct E
- 19119 Silver Creek Ave E
- 19205 87th Avenue Ct E
- 19221 86th Ave E
- 19209 87th Avenue Ct E
- 19024 87th Avenue Ct E
- 19019 87th Avenue Ct E
- 19105 85th Avenue Ct E
- 19215 87th Avenue Ct E