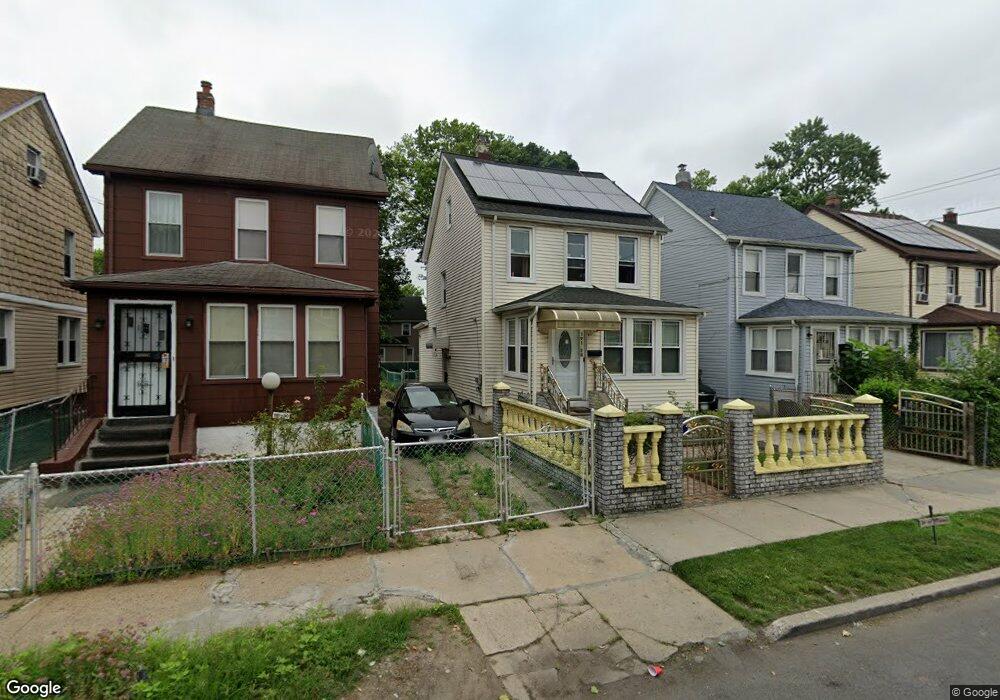
19128 Murdock Ave Saint Albans, NY 11412
Saint Albans NeighborhoodEstimated Value: $611,511 - $708,000
--
Bed
--
Bath
1,509
Sq Ft
$438/Sq Ft
Est. Value
About This Home
This home is located at 19128 Murdock Ave, Saint Albans, NY 11412 and is currently estimated at $660,628, approximately $437 per square foot. 19128 Murdock Ave is a home located in Queens County with nearby schools including P.S. 118 Lorraine Hansberry, Is 59 Springfield Gardens, and Riverton Street Charter School.
Ownership History
Date
Name
Owned For
Owner Type
Purchase Details
Closed on
Nov 30, 2004
Sold by
Thomas George and Thompson Selvyn
Bought by
Thomas George and Thomas Marjorie
Current Estimated Value
Purchase Details
Closed on
Apr 19, 2004
Sold by
Matthew Prince A
Bought by
Thompson Selvyn
Home Financials for this Owner
Home Financials are based on the most recent Mortgage that was taken out on this home.
Original Mortgage
$249,500
Interest Rate
5.36%
Mortgage Type
Purchase Money Mortgage
Purchase Details
Closed on
Sep 15, 2000
Sold by
Clarke Yvonne E and Matthew Prince Albert
Bought by
Matthew Prince Albert
Home Financials for this Owner
Home Financials are based on the most recent Mortgage that was taken out on this home.
Original Mortgage
$125,000
Interest Rate
7.94%
Create a Home Valuation Report for This Property
The Home Valuation Report is an in-depth analysis detailing your home's value as well as a comparison with similar homes in the area
Home Values in the Area
Average Home Value in this Area
Purchase History
| Date | Buyer | Sale Price | Title Company |
|---|---|---|---|
| Thomas George | -- | -- | |
| Thomas George | -- | -- | |
| Thompson Selvyn | $262,250 | -- | |
| Thompson Selvyn | $262,250 | -- | |
| Matthew Prince Albert | -- | Stewart Title Insurance Co | |
| Matthew Prince Albert | -- | Stewart Title Insurance Co |
Source: Public Records
Mortgage History
| Date | Status | Borrower | Loan Amount |
|---|---|---|---|
| Previous Owner | Thompson Selvyn | $249,500 | |
| Previous Owner | Matthew Prince Albert | $125,000 |
Source: Public Records
Tax History Compared to Growth
Tax History
| Year | Tax Paid | Tax Assessment Tax Assessment Total Assessment is a certain percentage of the fair market value that is determined by local assessors to be the total taxable value of land and additions on the property. | Land | Improvement |
|---|---|---|---|---|
| 2025 | $4,240 | $26,266 | $7,244 | $19,022 |
| 2024 | $3,957 | $24,910 | $6,452 | $18,458 |
| 2023 | $3,957 | $23,501 | $5,542 | $17,959 |
| 2022 | $1,775 | $40,920 | $11,220 | $29,700 |
| 2021 | $2,016 | $35,940 | $11,220 | $24,720 |
| 2020 | $3,974 | $32,340 | $11,220 | $21,120 |
| 2019 | $3,683 | $28,920 | $11,220 | $17,700 |
| 2018 | $3,333 | $19,584 | $7,710 | $11,874 |
| 2017 | $3,141 | $18,576 | $8,411 | $10,165 |
| 2016 | $3,092 | $18,576 | $8,411 | $10,165 |
| 2015 | $1,675 | $18,240 | $12,480 | $5,760 |
| 2014 | $1,675 | $17,299 | $11,875 | $5,424 |
Source: Public Records
Map
Nearby Homes
- 191-34 114th Rd
- 191-47 114th Dr
- 191-16 114th Rd
- 19431 114th Rd
- 19427 Murdock Ave
- 194-42 Murdock Ave
- 19432 113th Rd
- 19445 Murdock Ave
- 194-19 115th Rd
- 194-56 Murdock Ave
- 189-18 114th Dr
- 18908 114th Rd
- 191-68 115th Rd
- 194-34 115th Rd
- 191-40 112th Rd
- 114-22 197th St
- 18918 Tioga Dr
- 114-28 198th St
- 194-16 112th Ave
- 114-64 198th St
- 19130 Murdock Ave
- 19124 Murdock Ave
- 19134 Murdock Ave
- 19122 Murdock Ave
- 19136 Murdock Ave
- 19118 Murdock Ave
- 19127 114th Rd
- 19123 114th Rd
- 19129 114th Rd
- 19121 114th Rd
- 19133 114th Rd
- 19140 Murdock Ave
- 19116 Murdock Ave
- 19116 114th Dr
- 19116 114th Dr
- 19140 114th Dr
- 19127 114th Dr
- 19127 114th Dr
- 19117 114th Rd
- 19135 114th Rd