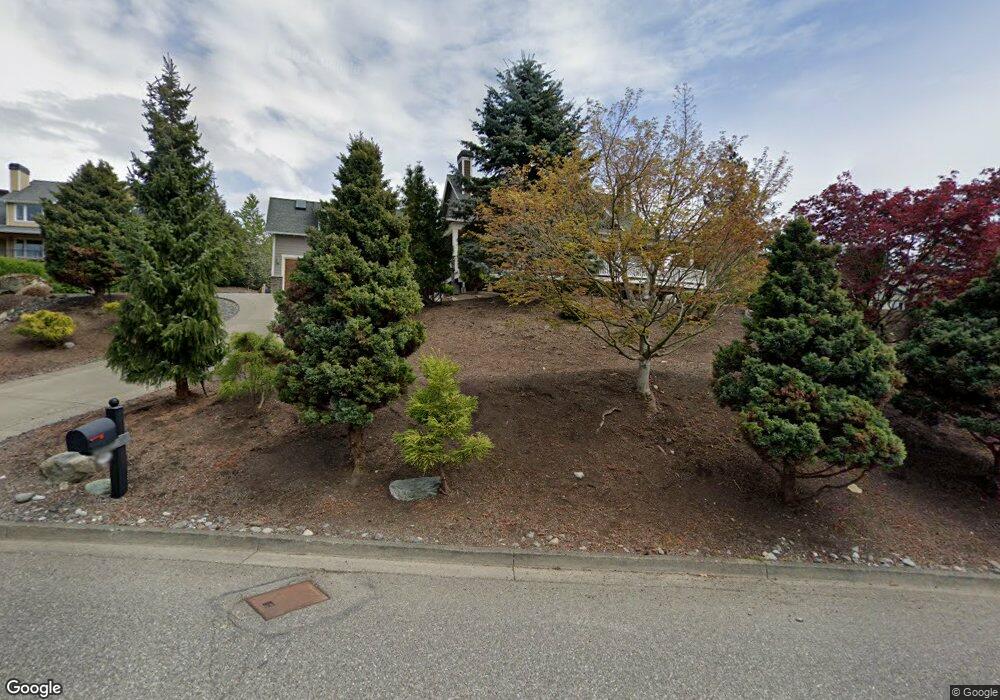
1913 40th St Bellingham, WA 98229
Samish NeighborhoodEstimated Value: $1,503,000 - $1,722,000
4
Beds
3
Baths
3,031
Sq Ft
$537/Sq Ft
Est. Value
About This Home
This home is located at 1913 40th St, Bellingham, WA 98229 and is currently estimated at $1,626,685, approximately $536 per square foot. 1913 40th St is a home located in Whatcom County with nearby schools including Wade King Elementary School, Fairhaven Middle School, and Sehome High School.
Ownership History
Date
Name
Owned For
Owner Type
Purchase Details
Closed on
Jun 1, 2023
Sold by
Letavec Charles Albert and Letavec Kristee Ann
Bought by
Charles Albert Letavec And Kristee Ann Letave
Current Estimated Value
Purchase Details
Closed on
Oct 4, 2004
Sold by
Slusher Trent A and Slusher Amy M
Bought by
Letavec Charles A and Letavec Kristee A
Home Financials for this Owner
Home Financials are based on the most recent Mortgage that was taken out on this home.
Original Mortgage
$333,700
Interest Rate
5.82%
Mortgage Type
Purchase Money Mortgage
Purchase Details
Closed on
Dec 31, 2003
Sold by
Samish Hill Associates
Bought by
Slusher Trent A and Slusher Amy M
Home Financials for this Owner
Home Financials are based on the most recent Mortgage that was taken out on this home.
Original Mortgage
$463,200
Interest Rate
5.88%
Mortgage Type
Construction
Create a Home Valuation Report for This Property
The Home Valuation Report is an in-depth analysis detailing your home's value as well as a comparison with similar homes in the area
Home Values in the Area
Average Home Value in this Area
Purchase History
| Date | Buyer | Sale Price | Title Company |
|---|---|---|---|
| Charles Albert Letavec And Kristee Ann Letave | -- | None Listed On Document | |
| Letavec Charles A | $579,000 | First American Title Insuran | |
| Slusher Trent A | $209,900 | First American Title Ins |
Source: Public Records
Mortgage History
| Date | Status | Borrower | Loan Amount |
|---|---|---|---|
| Previous Owner | Letavec Charles A | $333,700 | |
| Previous Owner | Slusher Trent A | $463,200 | |
| Closed | Letavec Charles A | $198,300 |
Source: Public Records
Tax History Compared to Growth
Tax History
| Year | Tax Paid | Tax Assessment Tax Assessment Total Assessment is a certain percentage of the fair market value that is determined by local assessors to be the total taxable value of land and additions on the property. | Land | Improvement |
|---|---|---|---|---|
| 2024 | $11,684 | $1,450,314 | $675,760 | $774,554 |
| 2023 | $11,684 | $1,502,167 | $699,920 | $802,247 |
| 2022 | $9,577 | $1,278,447 | $595,680 | $682,767 |
| 2021 | $8,901 | $1,031,033 | $480,400 | $550,633 |
| 2020 | $8,741 | $904,408 | $421,400 | $483,008 |
| 2019 | $9,316 | $858,479 | $400,000 | $458,479 |
| 2018 | $9,672 | $917,306 | $465,465 | $451,841 |
| 2017 | $8,521 | $814,236 | $413,160 | $401,076 |
| 2016 | $7,762 | $749,704 | $380,160 | $369,544 |
| 2015 | $7,640 | $710,986 | $360,360 | $350,626 |
| 2014 | -- | $677,114 | $343,200 | $333,914 |
| 2013 | -- | $645,311 | $330,000 | $315,311 |
Source: Public Records
Map
Nearby Homes
- 2010 Samish Crest Way
- 1800 40th Place
- 4203 Harrison St
- 2500 Samish Way Unit 50
- 2500 Samish Way Unit 13
- 1615 Samish Way
- 2604 S 42nd St
- 2608 S 42nd St
- 2600 42nd
- 3605 Mill Ave
- 921 Whitewater Dr
- 3104 Wilson Ave
- 1000 Samish Way
- 1912 S Colby Ct
- 835 Samish Way
- 2815 Willis St
- 955 Colony Ct
- 2694 Donovan Ave Unit 32
- 4915 Samish Way Unit 60
- 4915 Samish Way Unit 66
- 2004 Finch Ct
- 2001 40th St
- 1909 40th St
- 1900 Samish Crest Way
- 2008 Finch Ct
- 2005 40th St
- 2003 Finch Ct
- 1916 40th St
- 1910 40th St
- 2002 40th St
- 2007 Finch Ct
- 4103 Parkhurst Dr
- 2009 40th St
- 2012 Finch Ct
- 2014 Falcon Ct
- 2006 40th St
- 1806 Samish Crest Way
- 1812 Samish Crest Way
- 2020 Falcon Ct
- 4201 Parkhurst Dr