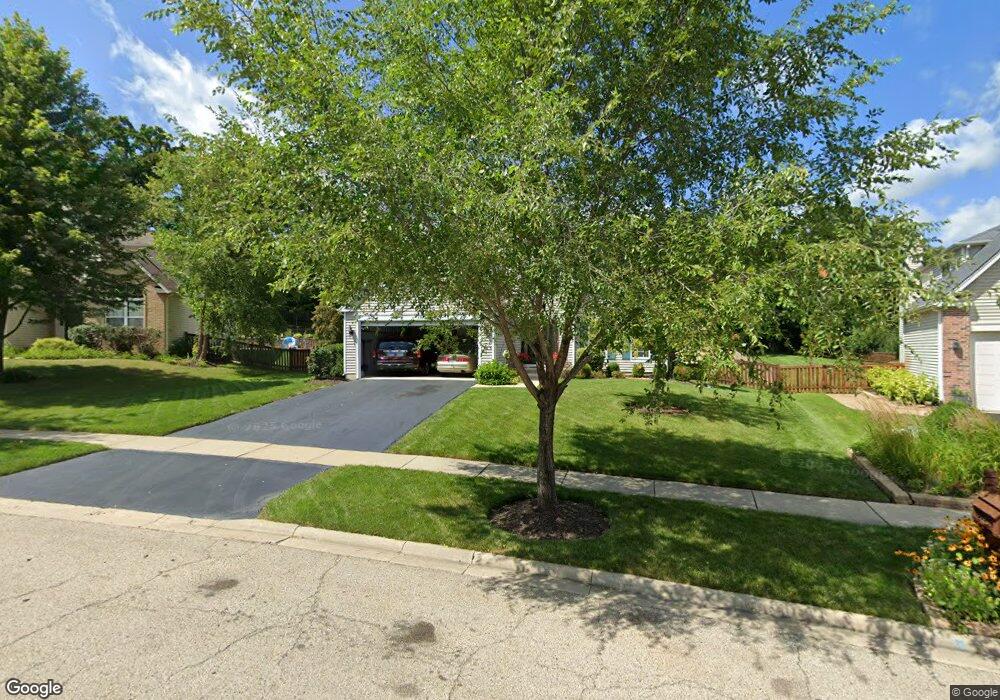
1913 Applewood Dr Wauconda, IL 60084
Estimated Value: $495,000 - $604,000
4
Beds
4
Baths
2,434
Sq Ft
$223/Sq Ft
Est. Value
About This Home
This home is located at 1913 Applewood Dr, Wauconda, IL 60084 and is currently estimated at $543,120, approximately $223 per square foot. 1913 Applewood Dr is a home located in Lake County with nearby schools including Robert Crown School, Wauconda Middle School, and Wauconda High School.
Ownership History
Date
Name
Owned For
Owner Type
Purchase Details
Closed on
Jun 7, 2017
Sold by
Olson Harold M and Olson Catherine A
Bought by
Olson Harold M and Olson Catherine A
Current Estimated Value
Purchase Details
Closed on
Apr 22, 2008
Sold by
Pakaski Robert and Pakaski Cynthia L
Bought by
Olson Harold M and Olson Catherine A
Home Financials for this Owner
Home Financials are based on the most recent Mortgage that was taken out on this home.
Original Mortgage
$280,000
Outstanding Balance
$176,534
Interest Rate
5.88%
Mortgage Type
Unknown
Estimated Equity
$366,586
Purchase Details
Closed on
Dec 24, 2003
Sold by
Neumann Homes Inc
Bought by
Pakaski Robert and Pakaski Cynthia L
Home Financials for this Owner
Home Financials are based on the most recent Mortgage that was taken out on this home.
Original Mortgage
$259,700
Interest Rate
4.87%
Mortgage Type
Unknown
Create a Home Valuation Report for This Property
The Home Valuation Report is an in-depth analysis detailing your home's value as well as a comparison with similar homes in the area
Home Values in the Area
Average Home Value in this Area
Purchase History
| Date | Buyer | Sale Price | Title Company |
|---|---|---|---|
| Olson Harold M | -- | Attorney | |
| Olson Harold M | $364,500 | Attorneys Title Guaranty Fun | |
| Pakaski Robert | $325,000 | -- |
Source: Public Records
Mortgage History
| Date | Status | Borrower | Loan Amount |
|---|---|---|---|
| Open | Olson Harold M | $280,000 | |
| Previous Owner | Pakaski Robert | $259,700 | |
| Closed | Pakaski Robert | $16,272 |
Source: Public Records
Tax History Compared to Growth
Tax History
| Year | Tax Paid | Tax Assessment Tax Assessment Total Assessment is a certain percentage of the fair market value that is determined by local assessors to be the total taxable value of land and additions on the property. | Land | Improvement |
|---|---|---|---|---|
| 2024 | $9,161 | $138,620 | $37,549 | $101,071 |
| 2023 | $10,667 | $109,233 | $29,589 | $79,644 |
| 2022 | $10,667 | $108,758 | $35,411 | $73,347 |
| 2021 | $10,157 | $102,766 | $33,460 | $69,306 |
| 2020 | $9,811 | $97,947 | $31,891 | $66,056 |
| 2019 | $8,777 | $93,326 | $30,140 | $63,186 |
| 2018 | $10,713 | $95,885 | $37,379 | $58,506 |
| 2017 | $11,657 | $111,207 | $36,947 | $74,260 |
| 2016 | $10,930 | $105,310 | $34,988 | $70,322 |
| 2015 | $10,245 | $96,677 | $32,120 | $64,557 |
| 2014 | $8,124 | $89,139 | $34,879 | $54,260 |
| 2012 | $8,475 | $80,579 | $33,372 | $47,207 |
Source: Public Records
Map
Nearby Homes
- 2460 Savanna Dr
- 2227 Trailside Ln Unit 1B
- 2511 Bluewater Dr Unit 1A
- 29564 N Garland Rd
- 29650 N Garland Rd
- 28722 N Madison Ave
- 28855 N Garland Rd
- 2810 Cattail Ct Unit B
- 2490 Olivia Ct
- 2486 Olivia Ct
- 2472 Olivia Ct
- 2800 Sweet Clover Way
- 2800 Cattail Ct Unit A
- 2403 Goldenrod Way
- 1260 Water Stone Cir
- 0 Bonner Rd
- 2483 Olivia Ct
- 2820 Glacier Way Unit B
- 2373 Heron Ln
- 29295 N Callahan Rd
- 1911 Applewood Dr
- 1909 Applewood Dr
- 1908 Applewood Dr
- 1917 Applewood Dr
- 1907 Applewood Dr
- 1906 Applewood Dr
- 1914 Apple Valley Dr
- 1905 Applewood Dr
- 1912 Apple Valley Dr
- 1907 Apple Valley Dr
- 1904 Applewood Dr
- 1903 Applewood Dr
- 1910 Apple Valley Dr
- 1902 Applewood Dr
- 1905 Apple Valley Dr
- 1908 Apple Valley Dr
- 1901 Applewood Dr
- 25352 Timothy Trail
- 1903 Apple Valley Dr
- 1900 Applewood Dr