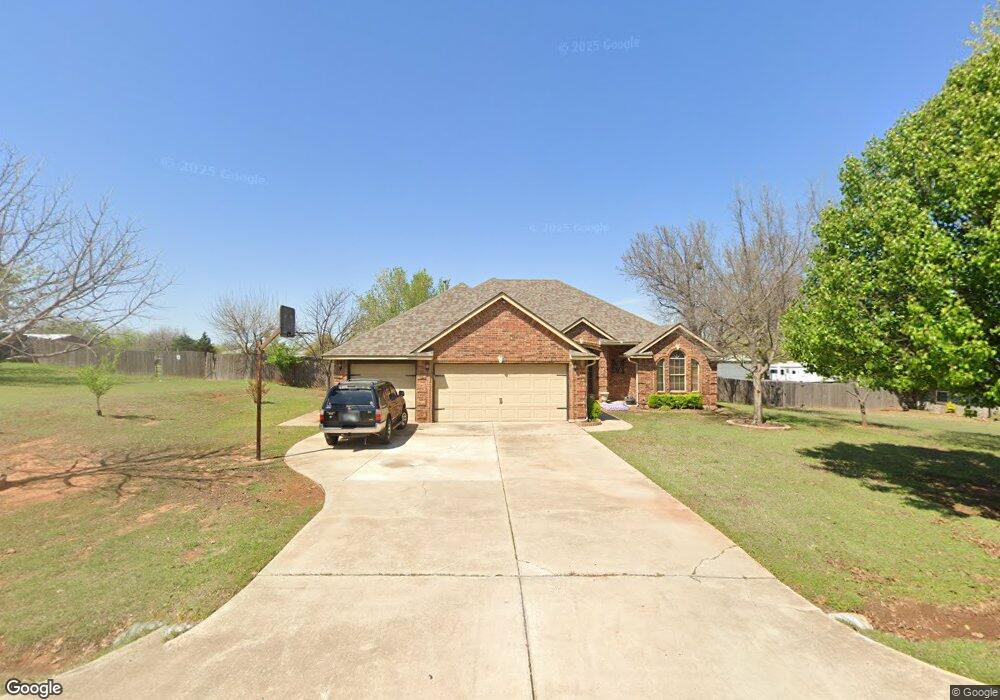
1913 SW 9th St Newcastle, OK 73065
Estimated Value: $281,000 - $310,000
3
Beds
2
Baths
1,683
Sq Ft
$177/Sq Ft
Est. Value
About This Home
This home is located at 1913 SW 9th St, Newcastle, OK 73065 and is currently estimated at $297,501, approximately $176 per square foot. 1913 SW 9th St is a home located in McClain County with nearby schools including Newcastle Elementary School, Newcastle Middle School, and Newcastle High School.
Ownership History
Date
Name
Owned For
Owner Type
Purchase Details
Closed on
Dec 20, 2008
Sold by
Scott Chance Roy and Scott Shari Renea
Bought by
Milligan Jason T and Milligan Carrie A
Current Estimated Value
Home Financials for this Owner
Home Financials are based on the most recent Mortgage that was taken out on this home.
Original Mortgage
$167,713
Outstanding Balance
$111,141
Interest Rate
6.19%
Mortgage Type
New Conventional
Estimated Equity
$186,361
Purchase Details
Closed on
Aug 29, 2007
Sold by
Doughty Michael N and Doughty Nancy J
Bought by
Milligan Jason T and Milligan Carrie A
Purchase Details
Closed on
Dec 21, 2006
Sold by
Tri City Builders Llc
Bought by
Scott Chance Roy and Scott Shari Renea
Home Financials for this Owner
Home Financials are based on the most recent Mortgage that was taken out on this home.
Original Mortgage
$163,900
Interest Rate
6.31%
Mortgage Type
New Conventional
Purchase Details
Closed on
Aug 25, 2006
Sold by
Gurley Jimmy Gerald and Gurley Lila Darlene
Bought by
Tri City Builder Llc
Create a Home Valuation Report for This Property
The Home Valuation Report is an in-depth analysis detailing your home's value as well as a comparison with similar homes in the area
Home Values in the Area
Average Home Value in this Area
Purchase History
| Date | Buyer | Sale Price | Title Company |
|---|---|---|---|
| Milligan Jason T | $173,000 | Stewart Abstract & Title Of | |
| Milligan Jason T | -- | None Available | |
| Scott Chance Roy | $164,000 | None Available | |
| Tri City Builder Llc | -- | None Available |
Source: Public Records
Mortgage History
| Date | Status | Borrower | Loan Amount |
|---|---|---|---|
| Open | Milligan Jason T | $167,713 | |
| Previous Owner | Scott Chance Roy | $163,900 |
Source: Public Records
Tax History Compared to Growth
Tax History
| Year | Tax Paid | Tax Assessment Tax Assessment Total Assessment is a certain percentage of the fair market value that is determined by local assessors to be the total taxable value of land and additions on the property. | Land | Improvement |
|---|---|---|---|---|
| 2024 | $2,605 | $22,723 | $4,851 | $17,872 |
| 2023 | $2,605 | $21,641 | $4,635 | $17,006 |
| 2022 | $2,328 | $20,168 | $4,323 | $15,845 |
| 2021 | $2,443 | $20,168 | $4,323 | $15,845 |
| 2020 | $2,453 | $20,168 | $4,323 | $15,845 |
| 2019 | $2,398 | $19,426 | $4,323 | $15,103 |
| 2018 | $2,403 | $19,762 | $4,323 | $15,439 |
| 2017 | $2,505 | $20,643 | $4,032 | $16,611 |
| 2016 | $2,395 | $19,660 | $3,977 | $15,683 |
| 2015 | $2,282 | $18,725 | $2,306 | $16,419 |
| 2014 | $2,220 | $18,454 | $2,306 | $16,148 |
Source: Public Records
Map
Nearby Homes
- 1656 Quail Ridge Rd
- 1829 Ranchwood Dr
- 2313 SW 16th St
- 1901 Timber Ridge Dr
- 318 Grigsby Rd
- 1339 Lucas Ct
- 1700 S Rockwell Ave
- 0 Grigsby Rd Unit 1192835
- 1808 Timber Ridge Dr
- 1916 Timber Ridge Dr
- 1346 Lucas Ct
- 450 SW 11th St
- 2203 NW 3rd St
- 620 SW 5th St
- 975 Trunci Cir
- 436 Park Place Dr
- 442 Park Place Dr
- 417 Park Place Dr
- 1157 Trunci Way
- 1204 Lucas Ct
- 1917 SW 9th St
- 1909 SW 9th St
- 1921 SW 9th St
- 1905 SW 9th St
- 1912 SW 9th St
- 1916 SW 9th St
- 1908 SW 9th St
- 1920 SW 9th St
- 1925 SW 9th St
- 1901 SW 9th St
- 1928 SW 9th St
- 1929 SW 9th St
- 800 Springlake Rd
- 708 Springlake Rd
- 900 Springlake Rd
- 716 Springlake Rd
- 700 Springlake Rd
- 1000 Springlake Rd
- 1200 Springlake Rd
- 1050 Springlake Rd