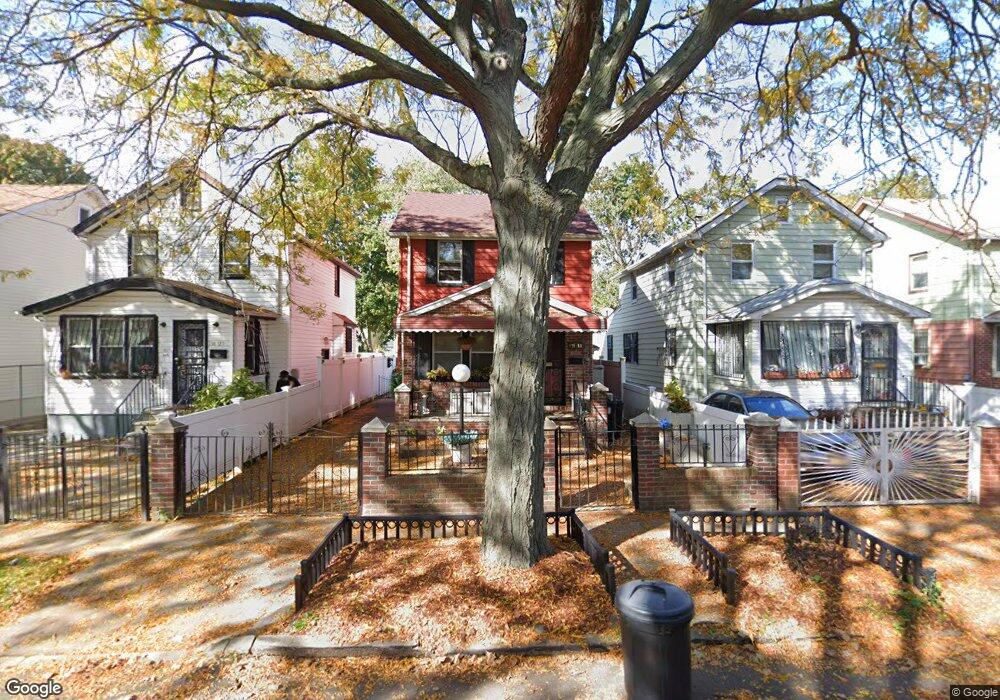
19131 114th Dr Saint Albans, NY 11412
Saint Albans NeighborhoodEstimated Value: $536,251 - $789,000
--
Bed
--
Bath
1,044
Sq Ft
$612/Sq Ft
Est. Value
About This Home
This home is located at 19131 114th Dr, Saint Albans, NY 11412 and is currently estimated at $638,563, approximately $611 per square foot. 19131 114th Dr is a home located in Queens County with nearby schools including Ps 36 St Albans School, Is 59 Springfield Gardens, and Riverton Street Charter School.
Ownership History
Date
Name
Owned For
Owner Type
Purchase Details
Closed on
Apr 30, 2001
Sold by
Ninan Kutty
Bought by
Jordan Lakimma S and Jordan Charles A
Current Estimated Value
Home Financials for this Owner
Home Financials are based on the most recent Mortgage that was taken out on this home.
Original Mortgage
$173,250
Outstanding Balance
$64,152
Interest Rate
7.08%
Mortgage Type
Purchase Money Mortgage
Estimated Equity
$574,411
Purchase Details
Closed on
Jul 7, 2000
Sold by
Onyiuke Chuma F
Bought by
Ninan Kutty
Purchase Details
Closed on
Sep 19, 1997
Sold by
Onyiuke Chuma F and Akwuobi John
Bought by
Onyiuke Chuma F
Purchase Details
Closed on
Jun 29, 1995
Sold by
Exotic Realty Inc
Bought by
Onyiuke Chuma F and Akwuobi John
Create a Home Valuation Report for This Property
The Home Valuation Report is an in-depth analysis detailing your home's value as well as a comparison with similar homes in the area
Home Values in the Area
Average Home Value in this Area
Purchase History
| Date | Buyer | Sale Price | Title Company |
|---|---|---|---|
| Jordan Lakimma S | -- | -- | |
| Jordan Lakimma S | -- | -- | |
| Ninan Kutty | $123,500 | Fidelity National Title Ins | |
| Ninan Kutty | $123,500 | Fidelity National Title Ins | |
| Onyiuke Chuma F | -- | -- | |
| Onyiuke Chuma F | -- | -- | |
| Onyiuke Chuma F | $134,000 | -- | |
| Onyiuke Chuma F | $134,000 | -- |
Source: Public Records
Mortgage History
| Date | Status | Borrower | Loan Amount |
|---|---|---|---|
| Open | Jordan Lakimma S | $173,250 | |
| Closed | Jordan Lakimma S | $173,250 |
Source: Public Records
Tax History Compared to Growth
Tax History
| Year | Tax Paid | Tax Assessment Tax Assessment Total Assessment is a certain percentage of the fair market value that is determined by local assessors to be the total taxable value of land and additions on the property. | Land | Improvement |
|---|---|---|---|---|
| 2025 | $4,391 | $24,656 | $7,481 | $17,175 |
| 2024 | $4,403 | $23,261 | $7,589 | $15,672 |
| 2023 | $4,127 | $21,946 | $6,881 | $15,065 |
| 2022 | $4,060 | $29,340 | $10,140 | $19,200 |
| 2021 | $4,286 | $28,440 | $10,140 | $18,300 |
| 2020 | $4,053 | $26,580 | $10,140 | $16,440 |
| 2019 | $3,762 | $27,660 | $10,140 | $17,520 |
| 2018 | $3,430 | $18,288 | $7,024 | $11,264 |
| 2017 | $2,566 | $18,144 | $7,704 | $10,440 |
| 2016 | $3,317 | $18,144 | $7,704 | $10,440 |
| 2015 | $1,845 | $17,123 | $9,277 | $7,846 |
| 2014 | $1,845 | $16,154 | $9,957 | $6,197 |
Source: Public Records
Map
Nearby Homes
- 191-47 114th Dr
- 191-34 114th Rd
- 191-16 114th Rd
- 191-68 115th Rd
- 194-19 115th Rd
- 19431 114th Rd
- 189-18 114th Dr
- 194-34 115th Rd
- 18908 114th Rd
- 19427 Murdock Ave
- 194-42 Murdock Ave
- 19432 113th Rd
- 19445 Murdock Ave
- 194-56 Murdock Ave
- 18918 Tioga Dr
- 115-72 Farmers Blvd
- 114-22 197th St
- 188-45 Quencer Rd
- 191-40 112th Rd
- 11608 196th St