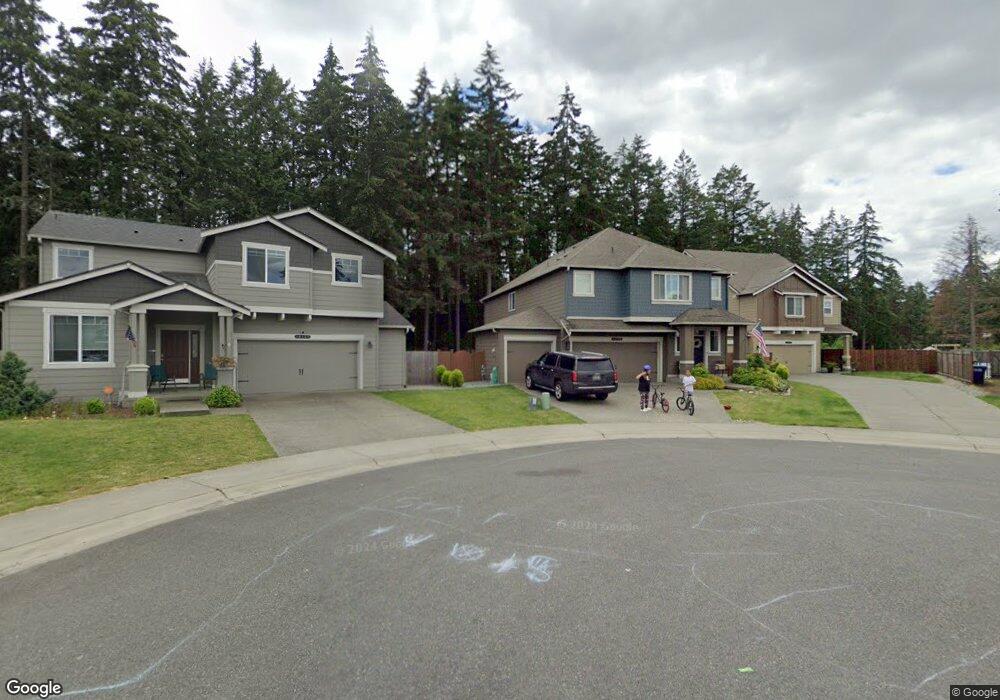
19136 110th Av Ct E Puyallup, WA 98374
Estimated Value: $670,380 - $716,000
5
Beds
3
Baths
3,036
Sq Ft
$231/Sq Ft
Est. Value
About This Home
This home is located at 19136 110th Av Ct E, Puyallup, WA 98374 and is currently estimated at $701,595, approximately $231 per square foot. 19136 110th Av Ct E is a home located in Pierce County with nearby schools including Nelson Elementary School, Frontier Middle School, and Graham Kapowsin High School.
Ownership History
Date
Name
Owned For
Owner Type
Purchase Details
Closed on
Aug 19, 2025
Sold by
Mahar Stephen and Mahar Victoria
Bought by
Mahar Revocable Living Trust and Mahar
Current Estimated Value
Purchase Details
Closed on
May 10, 2022
Sold by
Michael Cox Darrin and Michael Ekena-Edna L
Bought by
Mahar Stephen and Mahar Victoria
Home Financials for this Owner
Home Financials are based on the most recent Mortgage that was taken out on this home.
Original Mortgage
$740,740
Interest Rate
4.67%
Mortgage Type
VA
Purchase Details
Closed on
Jun 21, 2018
Sold by
Drh Energy Inc
Bought by
Cox Darrin Michael and Cox Ekena Edna L
Purchase Details
Closed on
Dec 13, 2017
Sold by
Sshi Llc
Bought by
Cox Darrin Michael and Cox Ekena Edna L
Home Financials for this Owner
Home Financials are based on the most recent Mortgage that was taken out on this home.
Original Mortgage
$383,795
Interest Rate
3.9%
Mortgage Type
New Conventional
Create a Home Valuation Report for This Property
The Home Valuation Report is an in-depth analysis detailing your home's value as well as a comparison with similar homes in the area
Home Values in the Area
Average Home Value in this Area
Purchase History
| Date | Buyer | Sale Price | Title Company |
|---|---|---|---|
| Mahar Revocable Living Trust | -- | None Listed On Document | |
| Mahar Stephen | -- | Rainier Title Company | |
| Cox Darrin Michael | -- | Accommodation | |
| Cox Darrin Michael | $403,714 | Chicago Title |
Source: Public Records
Mortgage History
| Date | Status | Borrower | Loan Amount |
|---|---|---|---|
| Previous Owner | Mahar Stephen | $740,740 | |
| Previous Owner | Cox Darrin Michael | $383,795 |
Source: Public Records
Tax History Compared to Growth
Tax History
| Year | Tax Paid | Tax Assessment Tax Assessment Total Assessment is a certain percentage of the fair market value that is determined by local assessors to be the total taxable value of land and additions on the property. | Land | Improvement |
|---|---|---|---|---|
| 2025 | $7,312 | $690,200 | $182,000 | $508,200 |
| 2024 | $7,312 | $639,000 | $176,100 | $462,900 |
| 2023 | $7,312 | $623,200 | $176,100 | $447,100 |
| 2022 | $6,834 | $677,400 | $176,100 | $501,300 |
| 2021 | $6,118 | $438,100 | $120,700 | $317,400 |
| 2019 | $4,790 | $423,900 | $108,600 | $315,300 |
| 2018 | $789 | $384,500 | $87,500 | $297,000 |
| 2017 | $0 | $51,500 | $51,500 | $0 |
Source: Public Records
Map
Nearby Homes
- 18945 112th Avenue Ct E
- 18818 111th Avenue Ct E
- 10710 188th St E
- 10957 188th St E
- 18776 107th Avenue Ct E
- 11604 188th St E
- 10671 187th Street Ct E
- 19411 107th Avenue Ct E
- 18731 116th Ave E
- 18708 108th Ave SE
- 18513 115th Ave E
- 19916 119th Avenue Ct E
- 10527 192nd Street Ct E
- 11422 184th Street Ct E
- 18422 110th Ave E
- 10609 197th St E
- 10509 192nd Street Ct E
- 10508 192nd Street Ct E
- 18328 110th Ave E
- 10415 194th Street Ct E
- 19136 110th Av Ct E Unit 24
- 19136 110th Avenue Ct E
- 19135 110th Avenue Ct E Unit 23
- 19135 110th Avenue Ct E
- 19135 110th Avenue Ct E
- 19132 110th Av Ct E Unit 25
- 19132 110th Av Ct E
- 19126 110th Avenue Ct E Unit 26
- 19126 110th Av Ct E Unit 26
- 19126 110th Av Ct E
- 19123 110th Av Ct E Unit 22
- 19123 110th Av Ct E
- 19123 110th Avenue Ct E
- 19122 110th Av Ct E Unit 27
- 19119 110th Av Ct E Unit 21
- 19118 110th Av Ct E Unit 21
- 19118 110th Av Ct E Unit 28
- 19111 110th Av Ct E Unit 20
- 19111 110th Av Ct E
- 19111 110th Avenue Ct E