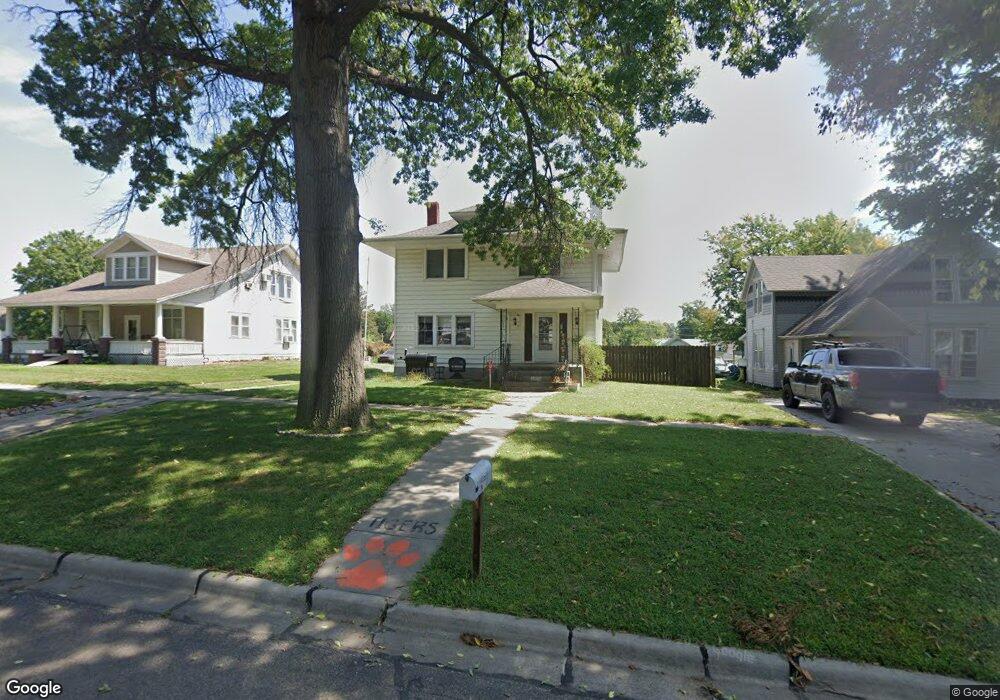
1914 Morton St Falls City, NE 68355
Estimated Value: $102,000 - $172,189
3
Beds
2
Baths
2,053
Sq Ft
$68/Sq Ft
Est. Value
About This Home
This home is located at 1914 Morton St, Falls City, NE 68355 and is currently estimated at $139,297, approximately $67 per square foot. 1914 Morton St is a home located in Richardson County with nearby schools including Falls City North Elementary School, Falls City South Elementary School, and Falls City Middle School.
Ownership History
Date
Name
Owned For
Owner Type
Purchase Details
Closed on
Dec 6, 2024
Sold by
Dean Andrew James
Bought by
Caspers Ashley M
Current Estimated Value
Purchase Details
Closed on
Sep 24, 2015
Sold by
Glathar Kristopher L and Glathar Allison M
Bought by
James Dean Andrew and Dean Ann Brooke
Purchase Details
Closed on
Nov 20, 2009
Sold by
Liberty Gary W and Liberty Catherine C
Bought by
Glathar Kristopher L and Glathar Allison M
Create a Home Valuation Report for This Property
The Home Valuation Report is an in-depth analysis detailing your home's value as well as a comparison with similar homes in the area
Home Values in the Area
Average Home Value in this Area
Purchase History
| Date | Buyer | Sale Price | Title Company |
|---|---|---|---|
| Caspers Ashley M | $100,000 | -- | |
| James Dean Andrew | $85,000 | -- | |
| Glathar Kristopher L | $72,000 | -- |
Source: Public Records
Tax History Compared to Growth
Tax History
| Year | Tax Paid | Tax Assessment Tax Assessment Total Assessment is a certain percentage of the fair market value that is determined by local assessors to be the total taxable value of land and additions on the property. | Land | Improvement |
|---|---|---|---|---|
| 2025 | $1,441 | $128,501 | $3,924 | $124,577 |
| 2024 | $1,441 | $121,449 | $3,924 | $117,525 |
| 2023 | $2,055 | $125,242 | $3,924 | $121,318 |
| 2022 | $2,284 | $118,972 | $1,912 | $117,060 |
| 2021 | $1,499 | $79,993 | $1,912 | $78,081 |
| 2020 | $1,445 | $76,275 | $1,912 | $74,363 |
| 2019 | $1,426 | $74,109 | $1,912 | $72,197 |
| 2018 | $1,399 | $72,006 | $1,912 | $70,094 |
| 2017 | $1,401 | $72,006 | $1,912 | $70,094 |
| 2016 | $1,355 | $69,964 | $1,912 | $68,052 |
| 2015 | $1,360 | $69,964 | $1,912 | $68,052 |
| 2014 | $1,358 | $69,964 | $1,912 | $68,052 |
Source: Public Records
Map
Nearby Homes