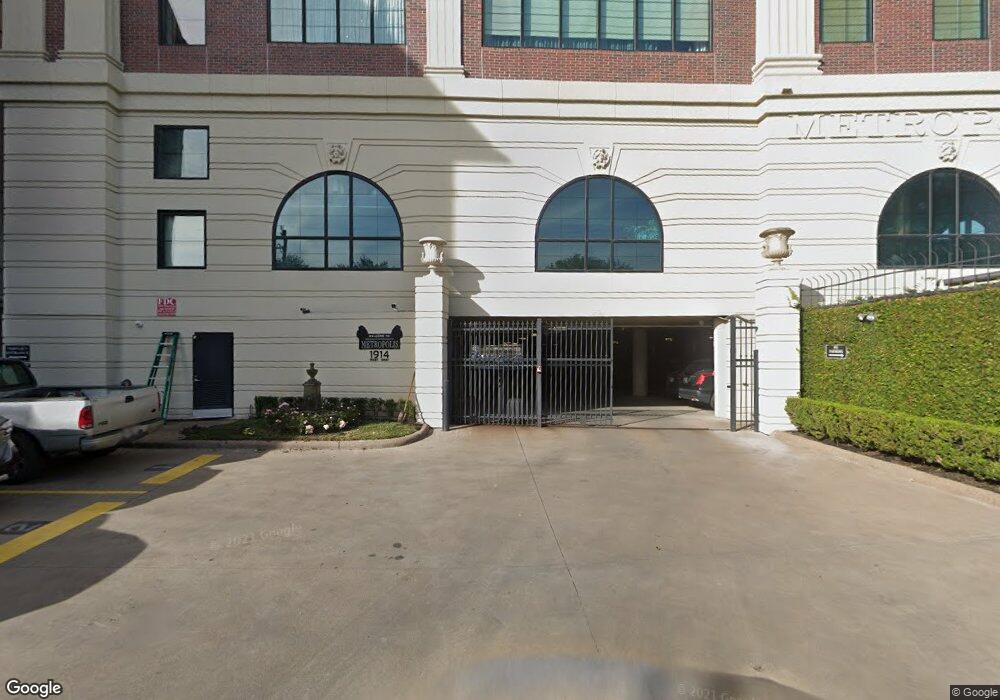
The Metropolis Lofts 1914 W Gray St Unit 306 Houston, TX 77019
Montrose NeighborhoodEstimated Value: $592,000 - $651,000
2
Beds
2
Baths
2,435
Sq Ft
$253/Sq Ft
Est. Value
About This Home
This home is located at 1914 W Gray St Unit 306, Houston, TX 77019 and is currently estimated at $616,915, approximately $253 per square foot. 1914 W Gray St Unit 306 is a home located in Harris County with nearby schools including Baker Montessori, Lanier Middle School, and Lamar High School.
Ownership History
Date
Name
Owned For
Owner Type
Purchase Details
Closed on
Jun 6, 2002
Sold by
Hirt Janice
Bought by
Carlitz Jeffrey M
Current Estimated Value
Home Financials for this Owner
Home Financials are based on the most recent Mortgage that was taken out on this home.
Original Mortgage
$300,700
Interest Rate
6.89%
Purchase Details
Closed on
Sep 17, 2001
Sold by
Hochberg Eric
Bought by
Stephens David
Home Financials for this Owner
Home Financials are based on the most recent Mortgage that was taken out on this home.
Original Mortgage
$275,000
Interest Rate
5.87%
Purchase Details
Closed on
Feb 9, 1998
Sold by
Metropolis Venture Partners Lp
Bought by
Findsen Marc J
Home Financials for this Owner
Home Financials are based on the most recent Mortgage that was taken out on this home.
Original Mortgage
$209,000
Interest Rate
7.02%
Create a Home Valuation Report for This Property
The Home Valuation Report is an in-depth analysis detailing your home's value as well as a comparison with similar homes in the area
Home Values in the Area
Average Home Value in this Area
Purchase History
| Date | Buyer | Sale Price | Title Company |
|---|---|---|---|
| Carlitz Jeffrey M | -- | Alamo Title Company | |
| Stephens David | -- | American Title Co | |
| Findsen Marc J | -- | Ticor Title |
Source: Public Records
Mortgage History
| Date | Status | Borrower | Loan Amount |
|---|---|---|---|
| Closed | Carlitz Jeffrey M | $300,700 | |
| Previous Owner | Stephens David | $275,000 | |
| Previous Owner | Findsen Marc J | $209,000 | |
| Closed | Stephens David | $39,100 |
Source: Public Records
Tax History Compared to Growth
Tax History
| Year | Tax Paid | Tax Assessment Tax Assessment Total Assessment is a certain percentage of the fair market value that is determined by local assessors to be the total taxable value of land and additions on the property. | Land | Improvement |
|---|---|---|---|---|
| 2025 | $3,915 | $498,211 | $94,660 | $403,551 |
| 2024 | $3,915 | $598,443 | $113,704 | $484,739 |
| 2023 | $3,915 | $542,683 | $103,110 | $439,573 |
| 2022 | $10,618 | $482,208 | $91,620 | $390,588 |
| 2021 | $11,239 | $482,208 | $91,620 | $390,588 |
| 2020 | $12,071 | $498,464 | $94,708 | $403,756 |
| 2019 | $12,613 | $498,464 | $94,708 | $403,756 |
| 2018 | $6,436 | $498,464 | $94,708 | $403,756 |
| 2017 | $11,530 | $498,464 | $94,708 | $403,756 |
| 2016 | $10,482 | $395,000 | $75,050 | $319,950 |
| 2015 | $5,258 | $395,000 | $75,050 | $319,950 |
| 2014 | $5,258 | $350,000 | $66,500 | $283,500 |
Source: Public Records
About The Metropolis Lofts
Map
Nearby Homes
- 1914 W Gray St Unit 301
- 1609 Peden St
- 1935 W Clay St
- 1937 W Clay St
- 1520 Park St
- 1609 Park St
- 1908 Greenwich Place Dr
- 1804 Haddon St
- 1510 Morse St
- 1705 Park St
- 1545 Haddon St
- 1509 Mcduffie St
- 1606 Hazard St
- 1541 Nevada St
- 1201 Mcduffie St Unit 198
- 1201 Mcduffie St Unit 122
- 3307 W Lamar St Unit B
- 1902 Elmen St
- 1010 Rosine St Unit 309
- 1010 Rosine St Unit 407
- 1914 W Gray St Unit 1
- 1914 W Gray St Unit 202
- 1914 W Gray St Unit 103
- 1914 W Gray St Unit 305
- 1914 W Gray St Unit 308
- 1914 W Gray St Unit 105
- 1914 W Gray St Unit 201
- 1914 W Gray St Unit 401
- 1914 W Gray St Unit 106
- 1914 W Gray St Unit 107
- 1914 W Gray St Unit 1
- 1914 W Gray St Unit 203
- 1914 W Gray St Unit 404
- 1914 W Gray St Unit 206
- 1914 W Gray St Unit 307
- 1914 W Gray St Unit 207
- 1914 W Gray St Unit 204
- 1914 W Gray St Unit 205
- 1914 W Gray St Unit 104
- 1914 W Gray St Unit 408