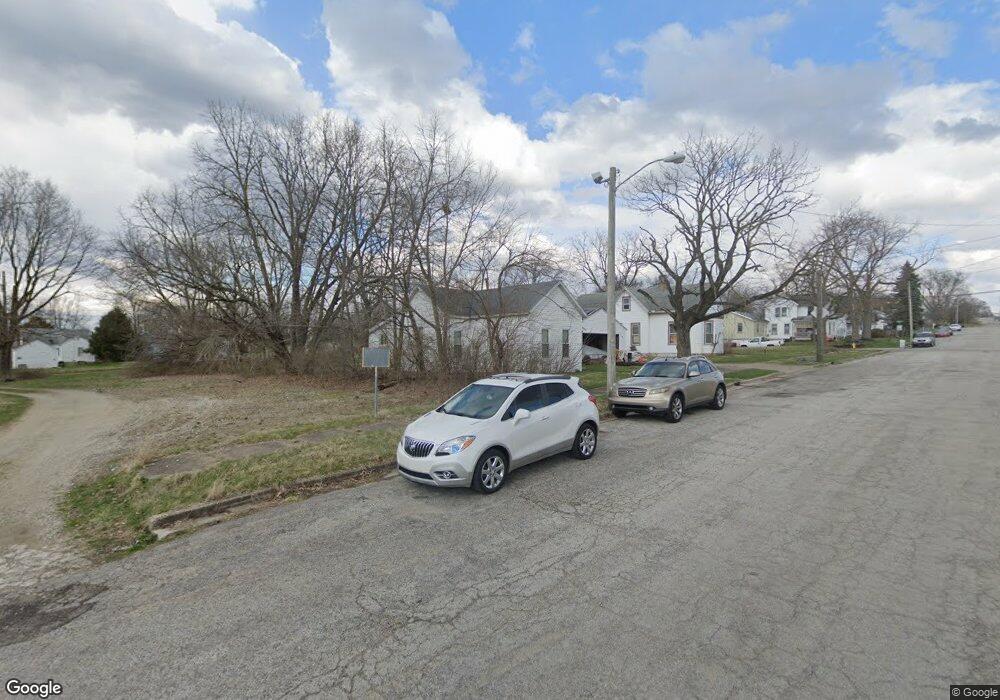
1914 W Jefferson St Springfield, OH 45506
Estimated Value: $67,551 - $103,000
2
Beds
1
Bath
975
Sq Ft
$88/Sq Ft
Est. Value
About This Home
This home is located at 1914 W Jefferson St, Springfield, OH 45506 and is currently estimated at $85,888, approximately $88 per square foot. 1914 W Jefferson St is a home located in Clark County with nearby schools including Snyder Park Elementary School, Roosevelt Middle School, and Springfield High School.
Ownership History
Date
Name
Owned For
Owner Type
Purchase Details
Closed on
Jun 25, 2020
Bought by
Garlind Properties Ltd
Current Estimated Value
Home Financials for this Owner
Home Financials are based on the most recent Mortgage that was taken out on this home.
Interest Rate
3.13%
Purchase Details
Closed on
Oct 1, 2016
Sold by
Cedargate Properties Llc
Bought by
Garlind Properties Ltd
Home Financials for this Owner
Home Financials are based on the most recent Mortgage that was taken out on this home.
Original Mortgage
$749,359
Interest Rate
6.75%
Mortgage Type
Land Contract Argmt. Of Sale
Purchase Details
Closed on
Feb 15, 2007
Sold by
Flora David and Flora David J
Bought by
Cedargate Properties Llc
Purchase Details
Closed on
Dec 8, 2005
Sold by
Cedargate Properties
Bought by
Flora David
Purchase Details
Closed on
Aug 17, 2005
Sold by
Patten James T
Bought by
Cedargate Properties
Purchase Details
Closed on
Oct 24, 1989
Create a Home Valuation Report for This Property
The Home Valuation Report is an in-depth analysis detailing your home's value as well as a comparison with similar homes in the area
Home Values in the Area
Average Home Value in this Area
Purchase History
| Date | Buyer | Sale Price | Title Company |
|---|---|---|---|
| Garlind Properties Ltd | $749,400 | -- | |
| Garlind Properties Ltd | $749,359 | Ohio Real Estate Title | |
| Cedargate Properties Llc | -- | Attorney | |
| Flora David | -- | -- | |
| Cedargate Properties | $9,135 | -- | |
| -- | $22,000 | -- |
Source: Public Records
Mortgage History
| Date | Status | Borrower | Loan Amount |
|---|---|---|---|
| Closed | Garlind Properties Ltd | -- | |
| Previous Owner | Garlind Properties Ltd | $749,359 |
Source: Public Records
Tax History
| Year | Tax Paid | Tax Assessment Tax Assessment Total Assessment is a certain percentage of the fair market value that is determined by local assessors to be the total taxable value of land and additions on the property. | Land | Improvement |
|---|---|---|---|---|
| 2025 | $591 | $15,250 | $2,600 | $12,650 |
| 2024 | $576 | $11,660 | $2,340 | $9,320 |
| 2023 | $576 | $11,660 | $2,340 | $9,320 |
| 2022 | $590 | $11,660 | $2,340 | $9,320 |
| 2021 | $509 | $9,260 | $1,860 | $7,400 |
| 2020 | $510 | $9,260 | $1,860 | $7,400 |
| 2019 | $511 | $9,260 | $1,860 | $7,400 |
| 2018 | $504 | $8,770 | $2,010 | $6,760 |
| 2017 | $504 | $8,765 | $2,006 | $6,759 |
| 2016 | $505 | $8,765 | $2,006 | $6,759 |
| 2015 | $478 | $8,135 | $1,859 | $6,276 |
| 2014 | $476 | $8,135 | $1,859 | $6,276 |
| 2013 | $471 | $8,135 | $1,859 | $6,276 |
Source: Public Records
Map
Nearby Homes
- 1915 W Washington St
- 1828 W Washington St
- 110 Walter St
- 106 Walter St
- 1906-1908 W High St
- 202 Seever St
- 22 Seever St
- 1618 W Pleasant St
- 1537 W Pleasant St
- 1504 W High St
- 2162 Broadway St
- 1715 W North St
- 40 Zischler St
- 1500 W Main St
- 1374 W Mulberry St
- 1417 W Main St
- 1362 W Mulberry St Unit 1364
- 1866 Maiden Ln
- 1420 Parker Ct
- 1524 W North St Unit 1526
- 1906 W Jefferson St
- 1904 W Jefferson St
- 1922 W Jefferson St
- 1924 W Jefferson St
- 216 Walter St
- 222 Walter St
- 222 Walter St
- 1917 W Washington St
- 1909 W Washington St
- 1898 W Jefferson St
- 1901 W Washington St
- 212 Walter St
- 1896 W Jefferson St
- 1890 W Jefferson St
- 206 Walter St
- 1835 W Washington St
- 1826 W Jefferson St
- 1820 W Jefferson St
- 1920 W Washington St
- 130 Walter St
Your Personal Tour Guide
Ask me questions while you tour the home.