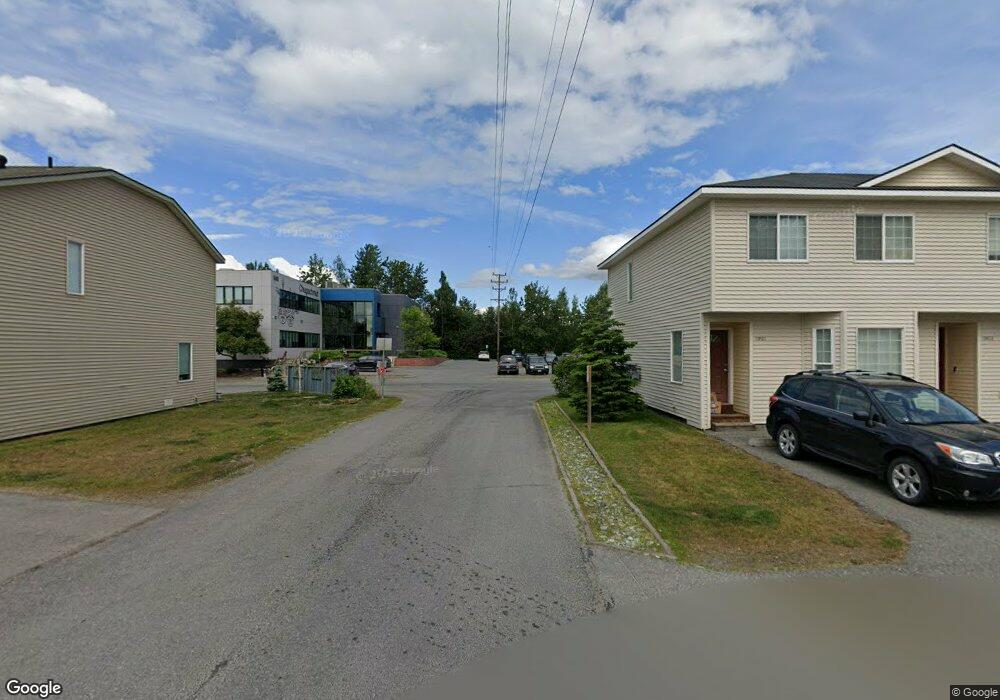
1915 Bragaw Square Place Unit 6 Anchorage, AK 99508
Airport Heights NeighborhoodEstimated Value: $247,000 - $254,350
3
Beds
2
Baths
1,446
Sq Ft
$173/Sq Ft
Est. Value
About This Home
This home is located at 1915 Bragaw Square Place Unit 6, Anchorage, AK 99508 and is currently estimated at $250,675, approximately $173 per square foot. 1915 Bragaw Square Place Unit 6 is a home located in Anchorage Municipality with nearby schools including Russian Jack Elementary School, Clark Middle School, and Bettye Davis East Anchorage High School.
Ownership History
Date
Name
Owned For
Owner Type
Purchase Details
Closed on
Aug 5, 2021
Sold by
Brantley Susan Beverly Jane and Viazon Susan
Bought by
Brantley Susan Beverly Jane
Current Estimated Value
Home Financials for this Owner
Home Financials are based on the most recent Mortgage that was taken out on this home.
Original Mortgage
$148,000
Outstanding Balance
$134,778
Interest Rate
3%
Mortgage Type
New Conventional
Estimated Equity
$115,897
Purchase Details
Closed on
May 29, 2009
Sold by
Newsome Truman B
Bought by
Newsome Truman B and Viazon Susan
Purchase Details
Closed on
Apr 20, 2006
Sold by
Hultquist Homes Inc
Bought by
Newsome Truman B
Home Financials for this Owner
Home Financials are based on the most recent Mortgage that was taken out on this home.
Original Mortgage
$167,575
Interest Rate
6.35%
Mortgage Type
FHA
Create a Home Valuation Report for This Property
The Home Valuation Report is an in-depth analysis detailing your home's value as well as a comparison with similar homes in the area
Home Values in the Area
Average Home Value in this Area
Purchase History
| Date | Buyer | Sale Price | Title Company |
|---|---|---|---|
| Brantley Susan Beverly Jane | -- | Amrock | |
| Newsome Truman B | -- | Accommodation | |
| Newsome Truman B | -- | None Available |
Source: Public Records
Mortgage History
| Date | Status | Borrower | Loan Amount |
|---|---|---|---|
| Open | Brantley Susan Beverly Jane | $148,000 | |
| Closed | Newsome Truman B | $167,575 |
Source: Public Records
Tax History Compared to Growth
Tax History
| Year | Tax Paid | Tax Assessment Tax Assessment Total Assessment is a certain percentage of the fair market value that is determined by local assessors to be the total taxable value of land and additions on the property. | Land | Improvement |
|---|---|---|---|---|
| 2025 | $3,040 | $204,600 | -- | $204,600 |
| 2024 | $3,040 | $188,300 | $0 | $188,300 |
| 2023 | $2,939 | $172,600 | $0 | $172,600 |
| 2022 | $3,129 | $185,800 | $0 | $185,800 |
| 2021 | $2,872 | $159,400 | $0 | $159,400 |
| 2020 | $2,672 | $157,200 | $0 | $157,200 |
| 2019 | $2,647 | $161,800 | $0 | $161,800 |
| 2018 | $2,768 | $168,800 | $0 | $168,800 |
| 2017 | $2,541 | $180,300 | $0 | $180,300 |
| 2016 | $2,448 | $176,900 | $0 | $176,900 |
| 2015 | $2,448 | $179,000 | $0 | $179,000 |
| 2014 | $2,448 | $161,500 | $0 | $161,500 |
Source: Public Records
Map
Nearby Homes
- 3964 Reka Dr Unit D3
- 4075 E 20th Ave Unit B44
- 1711 Russian Jack Dr Unit B4
- 3401 E 15th Ave
- 4610 Reka Dr Unit A11
- 1430 Columbine St
- 4660 Reka Dr Unit D8
- 000 Tr A Thurston
- 1414 Airport Heights Dr
- 4011 San Roberto Ave
- 2529 Wesleyan Dr
- 4333 San Ernesto Ave Unit W208
- 4333 San Ernesto Ave Unit 207A
- 1701 Aleutian St
- 4330 San Roberto Ave
- 4433 San Ernesto Ave Unit E104
- 4417 San Roberto Ave
- 2601 Palmer Ct Unit D4
- 5013 Marlowe Ave
- 1811 Talkeetna St
- 1987 Bragaw Square Place Unit 26
- 1985 Bragaw Square Place Unit 25
- 1983 Bragaw Square Place Unit 24
- 1981 Bragaw Square Place Unit 23
- 1979 Bragaw Square Place Unit 22
- 1921 Bragaw Square Place Unit 9
- 1919 Bragaw Square Place Unit 8
- 1917 Bragaw Square Place Unit 7
- 1911 Primrose Place Unit 40
- 1981 Bragaw Square Place Unit 25
- 1987 Bragaw Square Place Unit 22
- 1979 Bragaw Square Place Unit 26
- 1985 Bragaw Square Place Unit 23
- 1911 Primrose Place Unit 40
- 1914 Bragaw Square Place Unit 45
- 1914 Bragaw Square Place
- 1942 Bragaw Square Place Unit 52
- 1940 Bragaw Square Place Unit 51
- 1947 Bragaw Square Place Unit 16
- 1945 Bragaw Square Place Unit 15