Estimated Value: $218,082 - $275,000
3
Beds
3
Baths
1,572
Sq Ft
$154/Sq Ft
Est. Value
About This Home
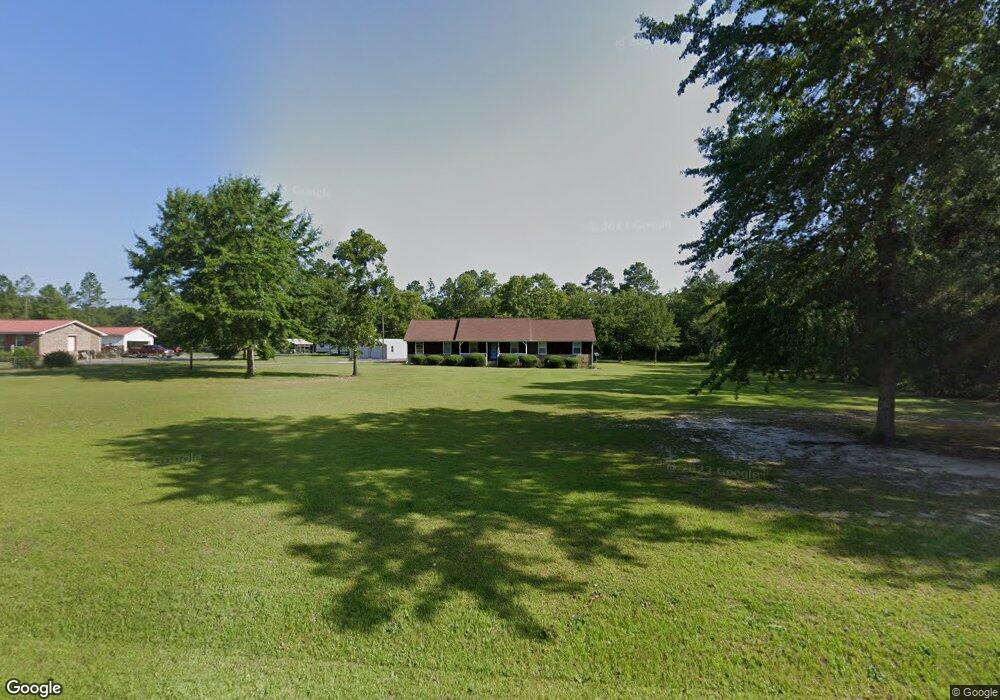
This home is located at 1915 Lower Hartley Bridge Rd, Byron, GA 31008 and is currently estimated at $241,521, approximately $153 per square foot. 1915 Lower Hartley Bridge Rd is a home located in Crawford County with nearby schools including Crawford County Elementary School, Crawford County Middle School, and Crawford County High School.
Ownership History
Date
Name
Owned For
Owner Type
Purchase Details
Closed on
Nov 28, 2012
Sold by
Sec Of Housing & U
Bought by
Wade Jason D
Current Estimated Value
Purchase Details
Closed on
May 23, 2012
Sold by
Citimortgage Inc
Bought by
Sec Of Housing & Urban
Purchase Details
Closed on
May 1, 2012
Sold by
Citimortgage Inc
Bought by
Citimortgage Inc
Purchase Details
Closed on
Jul 30, 2009
Sold by
Sullivan Kathryn
Bought by
Phippen Michael S
Home Financials for this Owner
Home Financials are based on the most recent Mortgage that was taken out on this home.
Original Mortgage
$126,627
Interest Rate
5.26%
Mortgage Type
FHA
Purchase Details
Closed on
Jul 12, 2005
Sold by
Mahoney Linda Hudman
Bought by
Sullivan James J and Sullivan Kathryn B
Create a Home Valuation Report for This Property
The Home Valuation Report is an in-depth analysis detailing your home's value as well as a comparison with similar homes in the area
Home Values in the Area
Average Home Value in this Area
Purchase History
| Date | Buyer | Sale Price | Title Company |
|---|---|---|---|
| Wade Jason D | -- | -- | |
| Sec Of Housing & Urban | $136,856 | -- | |
| Citimortgage Inc | $136,856 | -- | |
| Phippen Michael S | $129,000 | -- | |
| Sullivan James J | $98,000 | -- |
Source: Public Records
Mortgage History
| Date | Status | Borrower | Loan Amount |
|---|---|---|---|
| Previous Owner | Phippen Michael S | $126,627 |
Source: Public Records
Tax History Compared to Growth
Tax History
| Year | Tax Paid | Tax Assessment Tax Assessment Total Assessment is a certain percentage of the fair market value that is determined by local assessors to be the total taxable value of land and additions on the property. | Land | Improvement |
|---|---|---|---|---|
| 2024 | $2,073 | $66,016 | $8,400 | $57,616 |
| 2023 | $2,052 | $65,296 | $8,400 | $56,896 |
| 2022 | $1,584 | $54,096 | $8,400 | $45,696 |
| 2021 | $1,632 | $47,696 | $8,400 | $39,296 |
| 2020 | $1,632 | $47,696 | $8,400 | $39,296 |
| 2019 | $1,572 | $47,696 | $8,400 | $39,296 |
| 2018 | $1,572 | $47,696 | $8,400 | $39,296 |
| 2017 | $1,445 | $47,696 | $8,400 | $39,296 |
| 2016 | $1,572 | $47,696 | $8,400 | $39,296 |
Source: Public Records
Map
Nearby Homes
- 1984 Lower Hartley Bridge Rd
- 477 Mcgregor Cir
- 57 Margie Ct
- 156 Orion Way
- 84 Arrowhead Trail
- 2251 Boy Scout Rd
- 192 Lake Richardson Dr
- V L Hwy 42 Unit LotWP001
- 7209 Winterberry Cir
- 7220 Winterberry Cir
- 7212 Winterberry Cir
- 1947 Ga Highway 42
- 299 Chapman Rd
- 132 Hidden Creek Cir
- 208 Crystal Dr
- 1947 Georgia 42
- 169 Hidden Creek Cir
- 467 Kirkland Dr
- 1915 Lower Hartley Bridge Rd Unit 22
- 1903 Lower Hartley Bridge Rd
- 1977 Lower Hartley Bridge Rd
- 344 S Wood Dr
- 1916 Lower Hartley Bridge Rd
- 392 S Wood Dr
- 392 S Wood Dr Unit 215 Gleneagle drive
- 2003 Lower Hartley Bridge Rd
- 235 Gunter Mill Rd
- 1835 Lower Hartley Bridge Rd
- 1860 Lower Hartley Bridge Rd
- 2057 Lower Hartley Bridge Rd
- 2024 Lower Hartley Bridge Rd
- 286 S Wood Dr
- 235 Gunters Mill Rd
- 395 S Wood Dr
- 1856 Lower Hartley Bridge Rd
- 151 Gunters Mill Rd
- 339 S Wood Dr
- 1775 Lower Hartley Bridge Rd