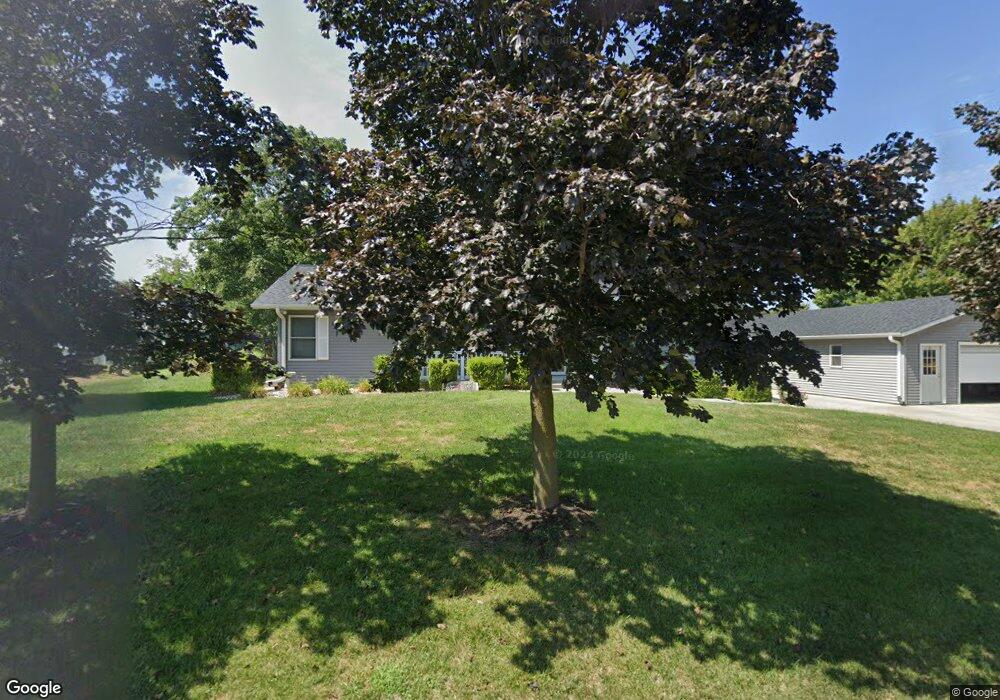
1915 Nemaha Ave Falls City, NE 68355
Estimated Value: $153,000 - $254,065
3
Beds
3
Baths
1,456
Sq Ft
$146/Sq Ft
Est. Value
About This Home
This home is located at 1915 Nemaha Ave, Falls City, NE 68355 and is currently estimated at $213,016, approximately $146 per square foot. 1915 Nemaha Ave is a home located in Richardson County with nearby schools including Falls City North Elementary School, Falls City South Elementary School, and Falls City Middle School.
Ownership History
Date
Name
Owned For
Owner Type
Purchase Details
Closed on
Oct 31, 2017
Sold by
Duane Eickhoff
Bought by
Eickhoff Phyllis and Eickhoff Lowell
Current Estimated Value
Purchase Details
Closed on
Sep 1, 2009
Sold by
Eickhoff Duane and Eickhoff Phyllis
Bought by
Eickhoff Life Est Duane & Phyllis
Purchase Details
Closed on
Sep 19, 2008
Sold by
Ernst Craig W and Ernst Cheryl L
Bought by
Eickhoff Duane and Eickhoff Phyllis
Purchase Details
Closed on
Apr 2, 2007
Sold by
Lippold Albert L
Bought by
Ernst Craig W and Ernst Cheryl L
Purchase Details
Closed on
Dec 20, 2006
Sold by
Fiedler Francis L
Bought by
Lippold Albert L
Create a Home Valuation Report for This Property
The Home Valuation Report is an in-depth analysis detailing your home's value as well as a comparison with similar homes in the area
Home Values in the Area
Average Home Value in this Area
Purchase History
| Date | Buyer | Sale Price | Title Company |
|---|---|---|---|
| Eickhoff Phyllis | $87,500 | -- | |
| Eickhoff Life Est Duane & Phyllis | -- | -- | |
| Eickhoff Duane | $42,500 | -- | |
| Ernst Craig W | $42,500 | -- | |
| Lippold Albert L | -- | -- |
Source: Public Records
Tax History Compared to Growth
Tax History
| Year | Tax Paid | Tax Assessment Tax Assessment Total Assessment is a certain percentage of the fair market value that is determined by local assessors to be the total taxable value of land and additions on the property. | Land | Improvement |
|---|---|---|---|---|
| 2025 | $2,879 | $246,834 | $5,975 | $240,859 |
| 2024 | $2,879 | $233,200 | $5,975 | $227,225 |
| 2023 | $3,117 | $190,011 | $5,975 | $184,036 |
| 2022 | $3,502 | $182,368 | $4,793 | $177,575 |
| 2021 | $3,439 | $183,557 | $4,793 | $178,764 |
| 2020 | $3,315 | $175,044 | $4,793 | $170,251 |
| 2019 | $3,272 | $170,085 | $4,793 | $165,292 |
| 2018 | $3,211 | $165,271 | $4,793 | $160,478 |
| 2017 | $3,216 | $165,271 | $4,793 | $160,478 |
| 2016 | $3,110 | $160,597 | $4,793 | $155,804 |
| 2015 | $3,121 | $160,597 | $4,793 | $155,804 |
| 2014 | $3,117 | $160,597 | $4,793 | $155,804 |
Source: Public Records
Map
Nearby Homes