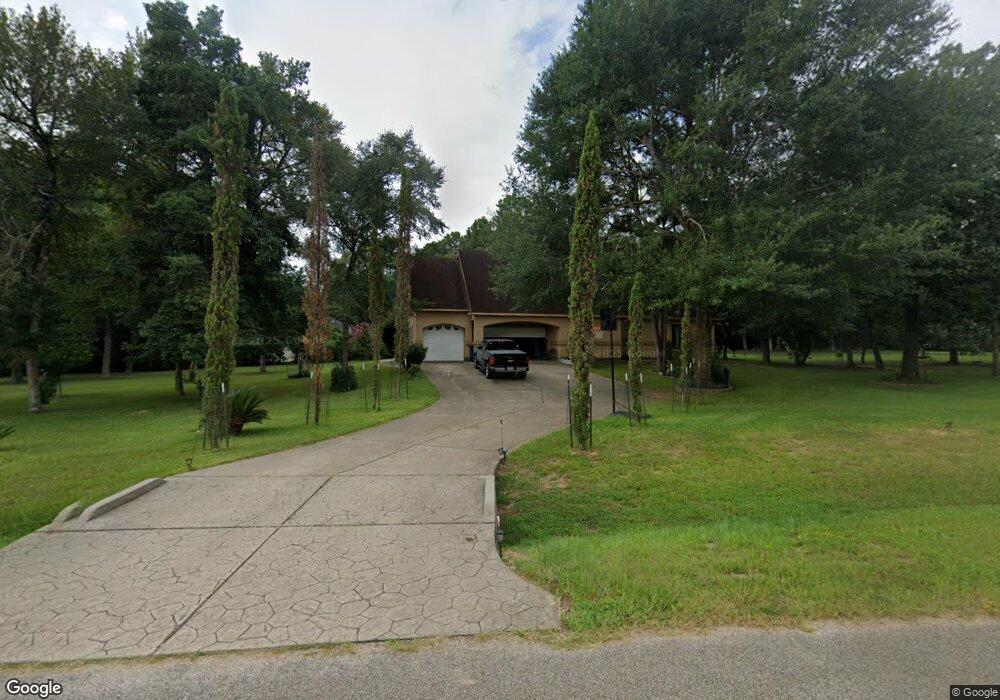
1915 Sendera Ranch Dr Magnolia, TX 77354
Estimated Value: $585,983 - $695,000
--
Bed
--
Bath
2,784
Sq Ft
$227/Sq Ft
Est. Value
About This Home
This home is located at 1915 Sendera Ranch Dr, Magnolia, TX 77354 and is currently estimated at $631,496, approximately $226 per square foot. 1915 Sendera Ranch Dr is a home located in Montgomery County with nearby schools including Lone Star Elementary School, Oak Hills Junior High School, and Lake Creek High School.
Ownership History
Date
Name
Owned For
Owner Type
Purchase Details
Closed on
Jul 31, 2013
Sold by
Bollom Robert J and Bollom Rosalie M
Bought by
Teague Bruce and Teague Morgan
Current Estimated Value
Home Financials for this Owner
Home Financials are based on the most recent Mortgage that was taken out on this home.
Original Mortgage
$40,000
Outstanding Balance
$29,004
Interest Rate
3.93%
Mortgage Type
Purchase Money Mortgage
Estimated Equity
$602,492
Purchase Details
Closed on
Jun 14, 2002
Sold by
Brown John W and Brown Mary Elizabeth
Bought by
Bollom Robert J and Bollom Rosalie M
Purchase Details
Closed on
Jun 11, 1997
Sold by
Ebco Land Development
Bought by
Teague Bruce and Teague Morgan
Create a Home Valuation Report for This Property
The Home Valuation Report is an in-depth analysis detailing your home's value as well as a comparison with similar homes in the area
Home Values in the Area
Average Home Value in this Area
Purchase History
| Date | Buyer | Sale Price | Title Company |
|---|---|---|---|
| Teague Bruce | -- | None Available | |
| Bollom Robert J | -- | Chicago Title | |
| Teague Bruce | -- | -- |
Source: Public Records
Mortgage History
| Date | Status | Borrower | Loan Amount |
|---|---|---|---|
| Open | Teague Bruce | $40,000 |
Source: Public Records
Tax History Compared to Growth
Tax History
| Year | Tax Paid | Tax Assessment Tax Assessment Total Assessment is a certain percentage of the fair market value that is determined by local assessors to be the total taxable value of land and additions on the property. | Land | Improvement |
|---|---|---|---|---|
| 2025 | $6,366 | $539,132 | -- | -- |
| 2024 | $6,735 | $490,120 | $226,875 | $263,245 |
| 2023 | $6,735 | $528,770 | $181,500 | $518,500 |
| 2022 | $8,357 | $480,700 | $143,750 | $456,250 |
| 2021 | $7,970 | $437,000 | $72,600 | $364,400 |
| 2020 | $7,943 | $415,000 | $72,600 | $342,400 |
| 2019 | $8,705 | $459,000 | $72,600 | $386,400 |
| 2018 | $7,687 | $424,540 | $54,450 | $370,090 |
| 2017 | $8,517 | $424,540 | $54,450 | $370,090 |
| 2016 | $7,595 | $378,580 | $54,450 | $324,130 |
| 2015 | $505 | $54,450 | $54,450 | $0 |
| 2014 | $505 | $25,410 | $25,410 | $0 |
Source: Public Records
Map
Nearby Homes
- 1817 Ranch Trail Ct
- 2302 E Blue Lake Dr
- 2426 Blue Lake Dr
- 1518 Honea Egypt Rd
- 6221 Ranch Lake Dr
- 1411 Honea Egypt Rd
- 6114 E Bluff Dr
- 6422 Sugar Bush Dr
- 1910 Honea Egypt Rd
- 6802 W Bluff Dr
- 906 Weeping Willow Way
- 6626 Grant Dr
- 906 Wiley Dr
- 803 Box Elder Dr
- 6107 Cypress Way Dr
- 6906 Grant Dr
- 914 Box Elder Dr
- 5918 Mahogany Way
- 6706 Durango Creek Dr
- 6718 Durango Creek Dr
- 1919 Sendera Ranch Dr
- 1911 Sendera Ranch Dr
- 2003 Sendera Ranch Dr
- 2110 E Blue Lake Dr
- 1914 Sendera Ranch Dr
- 2011 Sendera Ranch Dr
- 2102 E Blue Lake Dr
- 2210 E Blue Lake Dr
- 6502 Ranch Park Dr
- 6510 Ranch Park Dr
- 2019 Sendera Ranch Dr
- 6223 S Trace Dr
- 2218 E Blue Lake Dr
- Lot 28 S Trace Dr
- 407 S Trace Dr
- L 12 S Trace Dr
- L 9*10 S Trace Dr
- 6227 S Trace Dr
- L 9&10 S Trace Dr
- 6110 S Trace Dr