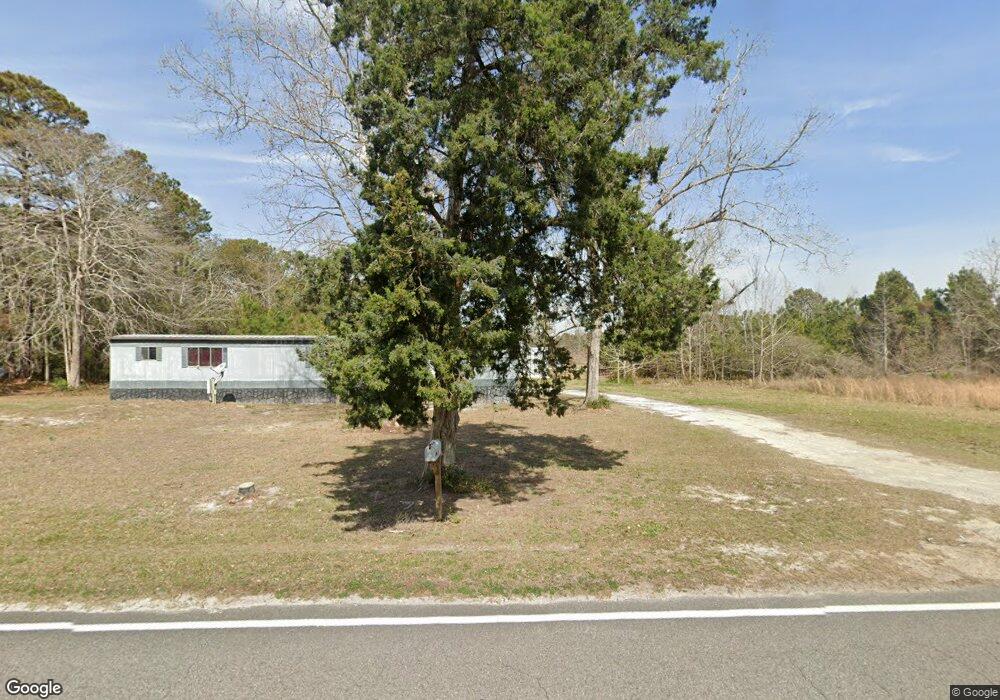
1916 Boones Neck Rd SW Supply, NC 28462
Estimated Value: $193,000 - $463,528
3
Beds
1
Bath
972
Sq Ft
$361/Sq Ft
Est. Value
About This Home
This home is located at 1916 Boones Neck Rd SW, Supply, NC 28462 and is currently estimated at $350,882, approximately $360 per square foot. 1916 Boones Neck Rd SW is a home located in Brunswick County with nearby schools including Virginia Williamson Elementary School, Cedar Grove Middle School, and West Brunswick High School.
Ownership History
Date
Name
Owned For
Owner Type
Purchase Details
Closed on
Aug 22, 2024
Sold by
Varnam Lisa Lewis and Varnam Samuel Neil
Bought by
Lisa Lewis Varnam Revocable Trust and Varnam
Current Estimated Value
Purchase Details
Closed on
Aug 25, 2021
Sold by
Cox Sandra P
Bought by
Varnam Samuel N and Varnam Lisa L
Purchase Details
Closed on
Dec 6, 2017
Sold by
Cox Sandra P
Bought by
All In Inc
Purchase Details
Closed on
Jan 6, 2012
Sold by
Potter Generett and Potter Helen
Bought by
Potter Generett and Potter Helen M
Purchase Details
Closed on
Oct 10, 2008
Sold by
Cox Brian Lee and Cox Sandra Gail
Bought by
Potter Generett and Potter Helen M
Purchase Details
Closed on
Jun 26, 2007
Sold by
Potter Carol J and Potter Thurman
Bought by
Cox Brian Lee and Cox Sandra Gail
Create a Home Valuation Report for This Property
The Home Valuation Report is an in-depth analysis detailing your home's value as well as a comparison with similar homes in the area
Home Values in the Area
Average Home Value in this Area
Purchase History
| Date | Buyer | Sale Price | Title Company |
|---|---|---|---|
| Lisa Lewis Varnam Revocable Trust | -- | None Listed On Document | |
| Samuel Neil Varnam Revocable Trust | -- | None Listed On Document | |
| Varnam Samuel N | $110,000 | None Available | |
| All In Inc | $15,000 | None Available | |
| Potter Generett | -- | None Available | |
| Potter Generett | -- | None Available | |
| Cox Brian Lee | -- | None Available |
Source: Public Records
Tax History Compared to Growth
Tax History
| Year | Tax Paid | Tax Assessment Tax Assessment Total Assessment is a certain percentage of the fair market value that is determined by local assessors to be the total taxable value of land and additions on the property. | Land | Improvement |
|---|---|---|---|---|
| 2025 | $789 | $405,220 | $352,450 | $52,770 |
| 2024 | $789 | $166,860 | $114,090 | $52,770 |
| 2023 | $704 | $166,860 | $114,090 | $52,770 |
| 2022 | $704 | $104,190 | $69,480 | $34,710 |
| 2021 | $0 | $104,190 | $69,480 | $34,710 |
| 2020 | $678 | $104,190 | $69,480 | $34,710 |
| 2019 | $678 | $97,060 | $69,480 | $27,580 |
| 2018 | $693 | $99,940 | $69,480 | $30,460 |
| 2017 | $511 | $123,160 | $92,700 | $30,460 |
| 2016 | $589 | $104,090 | $70,930 | $33,160 |
| 2015 | $589 | $126,280 | $70,930 | $55,350 |
| 2014 | $533 | $217,680 | $160,600 | $57,080 |
Source: Public Records
Map
Nearby Homes
- 2525 Brookford Ln SW
- 2184 Creekwood Ct SW
- 2398 Ocean Sound Cir SW
- 2180 Creekwood Ct SW
- 2529 Ocean Sound Cir SW
- 1641 Pine Valley Dr SW
- 1930 Aire St SW
- 2608 Eleanor St SW
- 1785 Horizon Dr SW
- 2163 Boones Neck Rd SW
- 2225 Kirby Rd SW
- 2550 White Sands Dr SW
- 2529 White Sands Dr SW
- 2633 Nags Head SW
- 1937 Estate St SW
- 1933 Estate St SW
- 2447 Pinewood Dr SW
- 1894 Muriel St SW
- 1773 Stanbury Rd SW
- 2699 Sea Aire Dr SW
- 923 Coastal Shores Rd SW
- 922 Coastal Shores Rd SW
- 1936 Boones Neck Rd SW
- 1917 Boones Neck Rd SW
- 1946 Boones Neck Rd SW
- 1935 Boones Neck Rd SW
- 2349 Quincy St
- 1968 Boones Neck Rd SW
- 1965 Boones Neck Rd SW
- 2394 Quincy St SW
- 1861 Boones Neck Rd SW
- 7+/- Acre Boonesneck SW
- 1991 Boonesneck Rd
- 1991 Boones Neck Rd SW
- 1973 Pointer Rd SW
- 1975 Pointer Rd SW
- 1985 Pointer Rd SW
- 1989 Pointer Rd SW
- 1998 Boones Neck Rd SW
- 1824 Boones Neck Rd SW