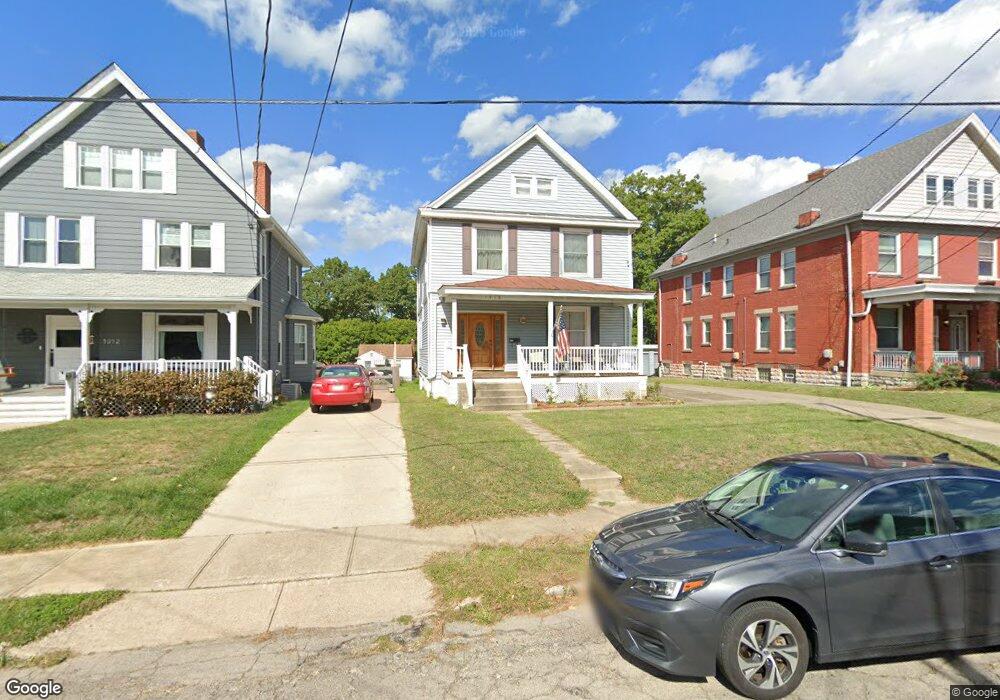
1916 Delaware Ave Cincinnati, OH 45212
Estimated Value: $337,225 - $416,000
3
Beds
2
Baths
2,322
Sq Ft
$156/Sq Ft
Est. Value
About This Home
This home is located at 1916 Delaware Ave, Cincinnati, OH 45212 and is currently estimated at $362,306, approximately $156 per square foot. 1916 Delaware Ave is a home located in Hamilton County with nearby schools including Norwood High School, Cornerstone Christian Academy, and Immaculate Conception Academy.
Ownership History
Date
Name
Owned For
Owner Type
Purchase Details
Closed on
Feb 18, 2025
Sold by
Gross James N
Bought by
Wang Yangjun
Current Estimated Value
Purchase Details
Closed on
Dec 19, 2022
Sold by
Gross James N and Gross Yangjun
Bought by
Gross James N and Wang Yangjun
Purchase Details
Closed on
Jul 27, 2004
Sold by
Federal National Mortgage Association
Bought by
Gross James N
Home Financials for this Owner
Home Financials are based on the most recent Mortgage that was taken out on this home.
Original Mortgage
$112,000
Interest Rate
6.4%
Mortgage Type
Fannie Mae Freddie Mac
Purchase Details
Closed on
Mar 2, 2004
Sold by
Pennington David Wayne and Baker Ruby
Bought by
Federal National Mortgage Association
Purchase Details
Closed on
Nov 4, 2002
Sold by
Ruby Pennington and Ruby R
Bought by
Pennington David Wayne
Home Financials for this Owner
Home Financials are based on the most recent Mortgage that was taken out on this home.
Original Mortgage
$100,000
Interest Rate
6.18%
Mortgage Type
Seller Take Back
Create a Home Valuation Report for This Property
The Home Valuation Report is an in-depth analysis detailing your home's value as well as a comparison with similar homes in the area
Home Values in the Area
Average Home Value in this Area
Purchase History
| Date | Buyer | Sale Price | Title Company |
|---|---|---|---|
| Wang Yangjun | -- | None Listed On Document | |
| Wang Yangjun | -- | None Listed On Document | |
| Gross James N | -- | -- | |
| Gross James N | $87,000 | Huntington Title Services | |
| Federal National Mortgage Association | $84,000 | -- | |
| Pennington David Wayne | -- | -- |
Source: Public Records
Mortgage History
| Date | Status | Borrower | Loan Amount |
|---|---|---|---|
| Previous Owner | Gross James N | $112,000 | |
| Previous Owner | Pennington David Wayne | $100,000 |
Source: Public Records
Tax History
| Year | Tax Paid | Tax Assessment Tax Assessment Total Assessment is a certain percentage of the fair market value that is determined by local assessors to be the total taxable value of land and additions on the property. | Land | Improvement |
|---|---|---|---|---|
| 2025 | $4,653 | $89,814 | $11,844 | $77,970 |
| 2024 | $4,528 | $89,814 | $11,844 | $77,970 |
| 2023 | $4,643 | $89,814 | $11,844 | $77,970 |
| 2022 | $4,343 | $70,567 | $7,952 | $62,615 |
| 2021 | $4,229 | $70,567 | $7,952 | $62,615 |
| 2020 | $4,235 | $70,567 | $7,952 | $62,615 |
| 2019 | $4,017 | $61,902 | $6,976 | $54,926 |
| 2018 | $4,022 | $61,902 | $6,976 | $54,926 |
| 2017 | $3,796 | $61,902 | $6,976 | $54,926 |
| 2016 | $3,341 | $52,480 | $6,556 | $45,924 |
| 2015 | $2,975 | $52,480 | $6,556 | $45,924 |
| 2014 | $2,967 | $52,480 | $6,556 | $45,924 |
| 2013 | $3,123 | $55,829 | $6,976 | $48,853 |
Source: Public Records
Map
Nearby Homes
- 1828 Williams Ave
- 2010 Hopkins Ave
- 4308 Carter Ave
- 4108 Montgomery Rd
- 4139 Huston Ave
- 4210 Lowry Ave
- 4206 Lafayette Ave
- 1846 Lincoln Ave
- 1841 Mills Ave
- 3951 Spencer Ave
- 1930 Hudson Ave
- 1846 Cleveland Ave
- 1762 Cleveland Ave
- 1901 Sherman Ave
- 3950 Elsmere Ave
- 2043 Lawrence Ave
- 2223 Madison Ave
- 3956 Hazel Ave
- 3910 Elsmere Ave
- 2049 Sherman Ave
- 1922 Delaware Ave
- 1912 Delaware Ave
- 1920 Delaware Ave
- 1924 Delaware Ave
- 1908 Delaware Ave
- 1910 Delaware Ave
- 1921 Hopkins Ave
- 1915 Hopkins Ave
- 1928 Delaware Ave
- 4130 Ivanhoe Ave
- 1925 Hopkins Ave
- 4128 Ivanhoe Ave
- 4120 Ivanhoe Ave
- 4122 Ivanhoe Ave
- 1919 Delaware Ave
- 1909 Hopkins Ave
- 1917 Delaware Ave
- 1921 Delaware Ave
- 1927 Hopkins Ave
- 1932 Delaware Ave
Your Personal Tour Guide
Ask me questions while you tour the home.