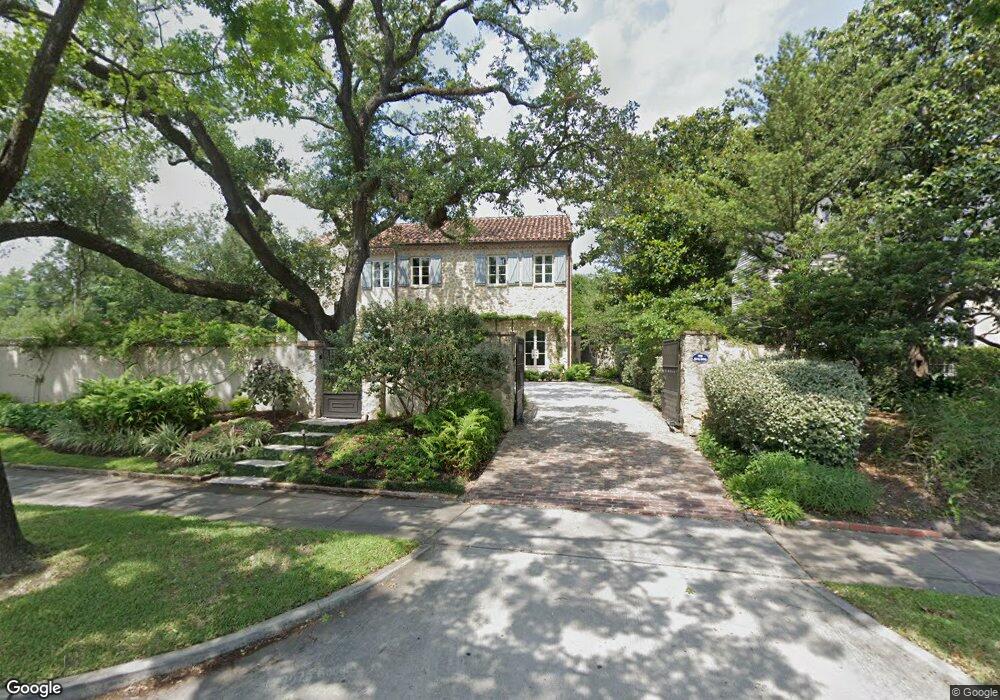
1916 Kirby Dr Houston, TX 77019
River Oaks NeighborhoodEstimated Value: $3,374,684 - $4,257,000
4
Beds
5
Baths
5,737
Sq Ft
$675/Sq Ft
Est. Value
About This Home
This home is located at 1916 Kirby Dr, Houston, TX 77019 and is currently estimated at $3,874,171, approximately $675 per square foot. 1916 Kirby Dr is a home located in Harris County with nearby schools including River Oaks Elementary School, Lanier Middle School, and Lamar High School.
Ownership History
Date
Name
Owned For
Owner Type
Purchase Details
Closed on
Sep 3, 2020
Sold by
Hamelet Jennifer L
Bought by
Corinne Guarraia 2011 Living Trust
Current Estimated Value
Purchase Details
Closed on
Jun 2, 2014
Sold by
Davidson Frances J
Bought by
Hamelet Jennifer L
Home Financials for this Owner
Home Financials are based on the most recent Mortgage that was taken out on this home.
Original Mortgage
$975,000
Interest Rate
4.38%
Mortgage Type
Purchase Money Mortgage
Purchase Details
Closed on
Nov 1, 1996
Sold by
Koelsch Francita Stuart
Bought by
Jones David Moore and Moore Jones Frances
Home Financials for this Owner
Home Financials are based on the most recent Mortgage that was taken out on this home.
Original Mortgage
$296,000
Interest Rate
8.15%
Purchase Details
Closed on
Jul 1, 1996
Sold by
Texas Commerce Bank National Assn and Butler Ann Showers
Bought by
Koelsch Francita Stuart
Create a Home Valuation Report for This Property
The Home Valuation Report is an in-depth analysis detailing your home's value as well as a comparison with similar homes in the area
Home Values in the Area
Average Home Value in this Area
Purchase History
| Date | Buyer | Sale Price | Title Company |
|---|---|---|---|
| Corinne Guarraia 2011 Living Trust | -- | Veritas Title Company | |
| Hamelet Jennifer L | -- | Alamo Title Co | |
| Jones David Moore | -- | Charter Title Company | |
| Koelsch Francita Stuart | -- | Stewart Title |
Source: Public Records
Mortgage History
| Date | Status | Borrower | Loan Amount |
|---|---|---|---|
| Previous Owner | Hamelet Jennifer L | $975,000 | |
| Previous Owner | Jones David Moore | $296,000 |
Source: Public Records
Tax History Compared to Growth
Tax History
| Year | Tax Paid | Tax Assessment Tax Assessment Total Assessment is a certain percentage of the fair market value that is determined by local assessors to be the total taxable value of land and additions on the property. | Land | Improvement |
|---|---|---|---|---|
| 2025 | $59,624 | $3,828,197 | $1,167,128 | $2,661,069 |
| 2024 | $59,624 | $3,607,674 | $1,096,393 | $2,511,281 |
| 2023 | $59,624 | $3,511,117 | $1,061,025 | $2,450,092 |
| 2022 | $77,285 | $3,509,937 | $990,290 | $2,519,647 |
| 2021 | $75,174 | $3,225,445 | $919,555 | $2,305,890 |
| 2020 | $77,794 | $3,212,527 | $919,555 | $2,292,972 |
| 2019 | $80,871 | $3,195,907 | $919,555 | $2,276,352 |
| 2018 | $61,120 | $3,019,200 | $919,555 | $2,099,645 |
| 2017 | $77,559 | $3,067,300 | $919,555 | $2,147,745 |
| 2016 | $75,857 | $3,000,000 | $919,555 | $2,080,445 |
| 2015 | $21,934 | $1,300,000 | $919,555 | $380,445 |
| 2014 | $21,934 | $1,117,084 | $778,085 | $338,999 |
Source: Public Records
Map
Nearby Homes
- 1915 Kirby Dr
- 2103 Argonne St Unit B
- 2121 Kirby Dr Unit 12N
- 2336 Welch St
- 2419 Mimosa Dr Unit 601
- 2419 Mimosa Dr Unit 801
- 2419 Mimosa Dr Unit 603
- 1913 Revere St
- 2413 Mimosa Dr
- 2323 San Felipe St Unit 901
- 2323 San Felipe St Unit 1101
- 2323 San Felipe St Unit 602
- 2525 Inwood Dr
- 2240 Mimosa Dr Unit 4W
- 2240 Mimosa Dr Unit 4N
- 2240 Mimosa Dr Unit PH-8W
- 2240 Mimosa Dr Unit 6W
- 2240 Mimosa Dr Unit 5W
- 2240 Mimosa Dr Unit 3N
- 2240 Mimosa Dr Unit 6E
- 1910 Kirby Dr
- 2914 San Felipe St
- 2005 Kirby Dr
- 2007 Kirby Dr
- 2011 Kirby Dr
- 1904 Kirby Dr
- 2915 Chevy Chase Dr
- 1914 Kirby Dr
- 2923 Chevy Chase Dr
- 1913 Kirby Dr
- 1911 Kirby Dr
- 1909 Kirby Dr
- 2929 Chevy Chase Dr
- 2533 Stanmore Dr
- 2932 San Felipe St
- 1903 Kirby Dr
- 2900 Chevy Chase Dr
- 2935 Chevy Chase Dr
- 2938 San Felipe St
- 2916 Chevy Chase Dr