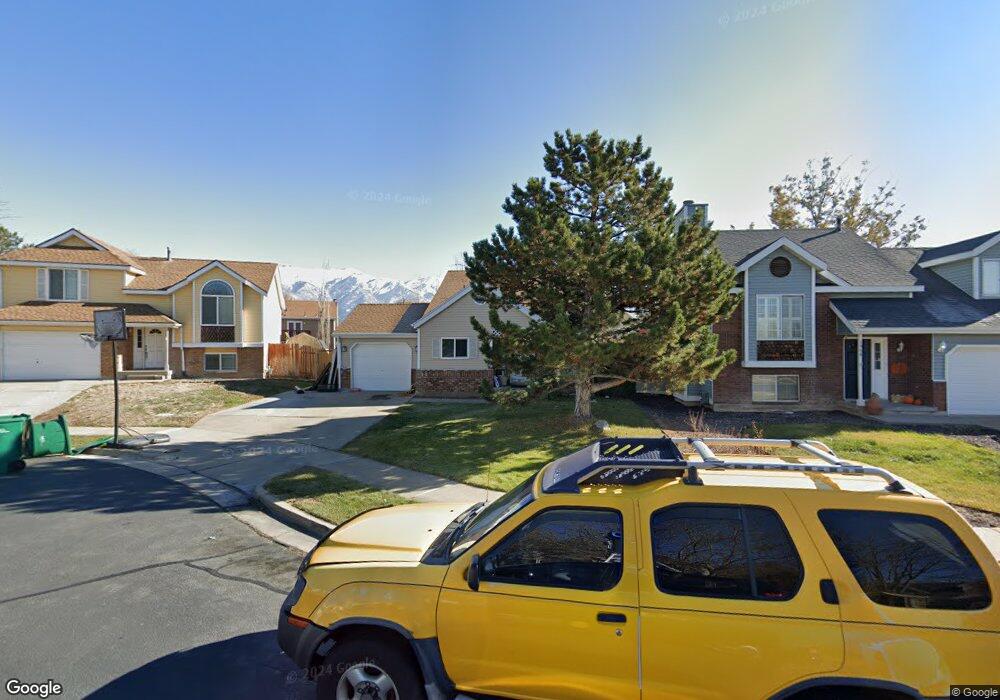
1916 N 350 W Layton, UT 84041
Estimated Value: $413,073 - $430,000
3
Beds
1
Bath
921
Sq Ft
$460/Sq Ft
Est. Value
About This Home
This home is located at 1916 N 350 W, Layton, UT 84041 and is currently estimated at $423,268, approximately $459 per square foot. 1916 N 350 W is a home located in Davis County with nearby schools including Lincoln Elementary School, North Layton Junior High School, and Northridge High School.
Ownership History
Date
Name
Owned For
Owner Type
Purchase Details
Closed on
Jul 1, 2025
Sold by
Stybe Sean and Stybe Lorianna
Bought by
Sean R Stybe Family Trust and Stybe
Current Estimated Value
Purchase Details
Closed on
Dec 11, 2020
Sold by
Stybe Sean and Estate Of Charles R Stybe
Bought by
Stybe Sean and Stybe Lorianna
Home Financials for this Owner
Home Financials are based on the most recent Mortgage that was taken out on this home.
Original Mortgage
$133,000
Interest Rate
2.8%
Mortgage Type
New Conventional
Purchase Details
Closed on
Dec 12, 2000
Sold by
Stybe Charles Randolph
Bought by
Stybe Charles R
Home Financials for this Owner
Home Financials are based on the most recent Mortgage that was taken out on this home.
Original Mortgage
$35,000
Interest Rate
7.67%
Purchase Details
Closed on
Aug 4, 1999
Sold by
Arciaga David F and Arciaga Michelle D
Bought by
Stybe Charles Randolph
Home Financials for this Owner
Home Financials are based on the most recent Mortgage that was taken out on this home.
Original Mortgage
$120,041
Interest Rate
7.64%
Mortgage Type
FHA
Create a Home Valuation Report for This Property
The Home Valuation Report is an in-depth analysis detailing your home's value as well as a comparison with similar homes in the area
Home Values in the Area
Average Home Value in this Area
Purchase History
| Date | Buyer | Sale Price | Title Company |
|---|---|---|---|
| Sean R Stybe Family Trust | -- | None Listed On Document | |
| Sean R Stybe Family Trust | -- | None Listed On Document | |
| Stybe Sean | -- | Stewart Title Ins Age | |
| Stybe Charles R | -- | Backman Stewart Title Servic | |
| Stybe Charles Randolph | -- | First American Title Ins Co |
Source: Public Records
Mortgage History
| Date | Status | Borrower | Loan Amount |
|---|---|---|---|
| Previous Owner | Stybe Sean | $133,000 | |
| Previous Owner | Stybe Charles R | $35,000 | |
| Previous Owner | Stybe Charles Randolph | $120,041 |
Source: Public Records
Tax History Compared to Growth
Tax History
| Year | Tax Paid | Tax Assessment Tax Assessment Total Assessment is a certain percentage of the fair market value that is determined by local assessors to be the total taxable value of land and additions on the property. | Land | Improvement |
|---|---|---|---|---|
| 2025 | $1,774 | $194,150 | $94,405 | $99,745 |
| 2024 | $1,774 | $187,549 | $110,719 | $76,830 |
| 2023 | $1,787 | $183,150 | $76,167 | $106,982 |
| 2022 | $1,799 | $331,000 | $129,368 | $201,632 |
| 2021 | $1,650 | $249,000 | $94,557 | $154,443 |
| 2020 | $1,485 | $215,000 | $81,742 | $133,258 |
| 2019 | $1,459 | $207,000 | $79,674 | $127,326 |
| 2018 | $1,299 | $185,000 | $79,674 | $105,326 |
| 2016 | $1,209 | $88,825 | $24,028 | $64,797 |
| 2015 | $1,156 | $80,630 | $24,028 | $56,602 |
| 2014 | $1,075 | $76,618 | $24,028 | $52,590 |
| 2013 | -- | $81,818 | $20,620 | $61,198 |
Source: Public Records
Map
Nearby Homes
- 247 W 1925 N
- 1837 N 440 W
- 2044 Evans Cove Loop
- 2048 Evans Cove Loop
- 1966 N 50 W
- 2187 N 450 W
- 2211 N 525 W
- 2248 N 500 W
- 1644 N 160 W
- 1676 Forbes Ave W
- 23 E 2150 N
- 1490 N 175 W
- 2378 N 675 W
- 160 W 1350 N
- 2402 N 725 W
- 2600 N Hill Field Rd Unit 4
- 2600 N Hill Field Rd Unit 138
- 2500 N Fort Ln Unit 238
- 2500 N Fort Ln Unit 189
- 1553 N 250 E