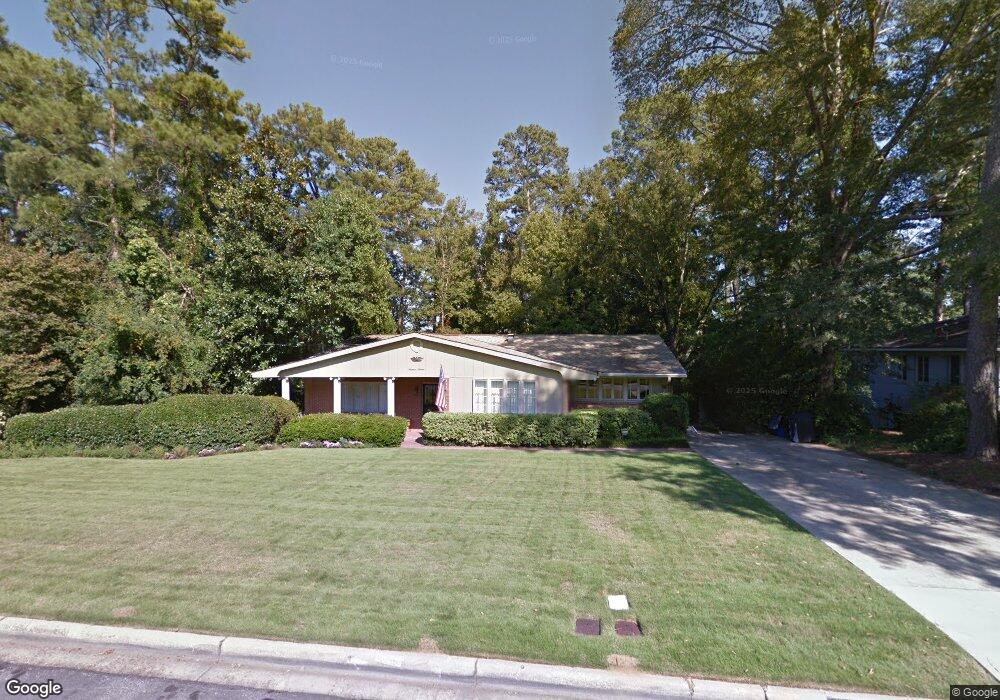
1916 Preston Dr Columbus, GA 31906
Wynnton Grove NeighborhoodEstimated Value: $356,000 - $405,359
4
Beds
3
Baths
2,385
Sq Ft
$163/Sq Ft
Est. Value
About This Home
This home is located at 1916 Preston Dr, Columbus, GA 31906 and is currently estimated at $387,840, approximately $162 per square foot. 1916 Preston Dr is a home located in Muscogee County with nearby schools including Wilkinson Elementary School, Clubview Elementary School, and Richards Middle School.
Ownership History
Date
Name
Owned For
Owner Type
Purchase Details
Closed on
Mar 6, 2018
Sold by
Patterson Real Estate Grp
Bought by
Brinkley Ashley C
Current Estimated Value
Home Financials for this Owner
Home Financials are based on the most recent Mortgage that was taken out on this home.
Original Mortgage
$240,378
Outstanding Balance
$210,580
Interest Rate
5.37%
Mortgage Type
FHA
Estimated Equity
$177,260
Purchase Details
Closed on
Mar 24, 2017
Bought by
Patterson Real Estate Grp Inc
Purchase Details
Closed on
Feb 7, 2017
Sold by
Farrow Harold S
Bought by
Wells Fargo Bank
Purchase Details
Closed on
Feb 3, 2014
Sold by
Cohn Leslie L
Bought by
Farrow Harold S and Farrow Shannon D
Home Financials for this Owner
Home Financials are based on the most recent Mortgage that was taken out on this home.
Original Mortgage
$171,830
Interest Rate
3.87%
Mortgage Type
FHA
Purchase Details
Closed on
May 12, 2011
Sold by
Cohn Aaron
Bought by
Cohn Aaron
Create a Home Valuation Report for This Property
The Home Valuation Report is an in-depth analysis detailing your home's value as well as a comparison with similar homes in the area
Home Values in the Area
Average Home Value in this Area
Purchase History
| Date | Buyer | Sale Price | Title Company |
|---|---|---|---|
| Brinkley Ashley C | $215,500 | -- | |
| Patterson Real Estate Grp Inc | $157,500 | -- | |
| Wells Fargo Bank | -- | -- | |
| Farrow Harold S | $175,000 | -- | |
| Cohn Aaron | -- | -- |
Source: Public Records
Mortgage History
| Date | Status | Borrower | Loan Amount |
|---|---|---|---|
| Open | Brinkley Ashley C | $240,378 | |
| Previous Owner | Farrow Harold S | $171,830 |
Source: Public Records
Tax History Compared to Growth
Tax History
| Year | Tax Paid | Tax Assessment Tax Assessment Total Assessment is a certain percentage of the fair market value that is determined by local assessors to be the total taxable value of land and additions on the property. | Land | Improvement |
|---|---|---|---|---|
| 2025 | $2,676 | $116,432 | $18,988 | $97,444 |
| 2024 | $2,675 | $116,432 | $18,988 | $97,444 |
| 2023 | $1,998 | $116,432 | $18,988 | $97,444 |
| 2022 | $2,790 | $88,108 | $18,988 | $69,120 |
| 2021 | $2,783 | $81,548 | $18,988 | $62,560 |
| 2020 | $2,784 | $81,548 | $18,988 | $62,560 |
| 2019 | $3,341 | $81,548 | $18,988 | $62,560 |
| 2018 | $2,581 | $63,000 | $14,640 | $48,360 |
| 2017 | $3,766 | $81,548 | $18,988 | $62,560 |
| 2016 | $2,888 | $70,001 | $11,482 | $58,519 |
| 2015 | $2,891 | $70,001 | $11,482 | $58,519 |
| 2014 | $3,131 | $75,721 | $11,482 | $64,239 |
| 2013 | -- | $75,721 | $11,482 | $64,239 |
Source: Public Records
Map
Nearby Homes
- 2010 Wells Dr
- 1712 Marilon Dr
- 1500 Preston Dr
- 2911 Gardenia St
- 1513 Wells Dr
- 1700 Stark Ave
- 2916 Gardenia St
- 1706 Stark Ave
- 2604 Sue MacK Dr
- 2940 Birchfield Dr
- 2533 15th St
- 1717 Stark Ave
- 2817 Carson Dr
- 2637 Sue MacK Dr
- 1310 S Dixon Dr
- 1809 Carter Ave
- 1301 Rigdon Rd
- 1319 Hilton Ave
- 2609 Hilton Ave
- 2220 Country Club Rd
- 1906 Preston Dr
- 1922 Preston Dr
- 1905 Iris Dr
- 1821 Iris Dr
- 1818 Preston Dr
- 1909 Iris Dr
- 2006 Preston Dr
- 1911 Preston Dr
- 0 Preston Dr Unit 187977
- 0 Preston Dr
- 2001 Iris Dr
- 1811 Iris Dr
- 1925 Preston Dr
- 1819 Preston Dr
- 2012 Preston Dr
- 1806 Preston Dr
- 1811 Preston Dr
- 2007 Iris Dr
- 2018 Preston Dr
- 1900 Iris Dr