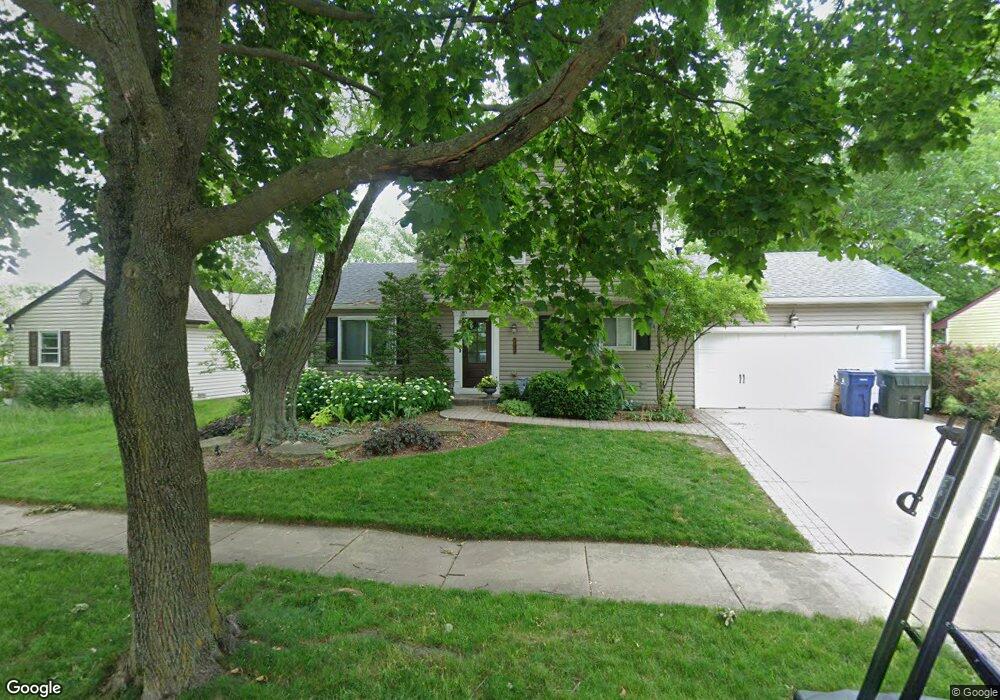
1916 Stanford Dr Naperville, IL 60565
University Heights NeighborhoodEstimated Value: $385,821 - $426,000
Studio
1
Bath
1,320
Sq Ft
$313/Sq Ft
Est. Value
About This Home
This home is located at 1916 Stanford Dr, Naperville, IL 60565 and is currently estimated at $413,205, approximately $313 per square foot. 1916 Stanford Dr is a home located in DuPage County with nearby schools including Meadow Glens Elementary School, Madison Jr High School, and Naperville Central High School.
Ownership History
Date
Name
Owned For
Owner Type
Purchase Details
Closed on
May 2, 2001
Sold by
Dubis Brian S and Dubis Jennifer L
Bought by
Kopczynski Joseph E and Kopczynski Kristin L
Current Estimated Value
Home Financials for this Owner
Home Financials are based on the most recent Mortgage that was taken out on this home.
Original Mortgage
$140,800
Outstanding Balance
$52,536
Interest Rate
7.02%
Estimated Equity
$360,669
Purchase Details
Closed on
Oct 15, 1997
Sold by
Kim Jaman L and Wernert James J
Bought by
Dubis Brian S and Dubis Jennifer L
Home Financials for this Owner
Home Financials are based on the most recent Mortgage that was taken out on this home.
Original Mortgage
$137,700
Interest Rate
7.51%
Mortgage Type
FHA
Create a Home Valuation Report for This Property
The Home Valuation Report is an in-depth analysis detailing your home's value as well as a comparison with similar homes in the area
Home Values in the Area
Average Home Value in this Area
Purchase History
We collect this data history from publicly available records. To have your information removed, we recommend requesting removal directly through your county’s website.
| Date | Buyer | Sale Price | Title Company |
|---|---|---|---|
| Kopczynski Joseph E | $176,000 | Burnet Title Llc | |
| Dubis Brian S | $140,000 | -- |
Source: Public Records
Mortgage History
We collect this data history from publicly available records. To have your information removed, we recommend requesting removal directly through your county’s website.
| Date | Status | Borrower | Loan Amount |
|---|---|---|---|
| Open | Kopczynski Joseph E | $140,800 | |
| Previous Owner | Dubis Brian S | $137,700 |
Source: Public Records
Tax History
| Year | Tax Paid | Tax Assessment Tax Assessment Total Assessment is a certain percentage of the fair market value that is determined by local assessors to be the total taxable value of land and additions on the property. | Land | Improvement |
|---|---|---|---|---|
| 2024 | $6,338 | $111,465 | $57,020 | $54,445 |
| 2023 | $6,090 | $101,730 | $52,040 | $49,690 |
| 2022 | $5,765 | $95,080 | $48,640 | $46,440 |
| 2021 | $5,549 | $91,480 | $46,800 | $44,680 |
| 2020 | $5,428 | $89,840 | $45,960 | $43,880 |
| 2019 | $5,262 | $85,950 | $43,970 | $41,980 |
| 2018 | $5,264 | $85,950 | $43,970 | $41,980 |
| 2017 | $5,153 | $83,050 | $42,490 | $40,560 |
| 2016 | $5,043 | $80,040 | $40,950 | $39,090 |
| 2015 | $5,001 | $75,370 | $38,560 | $36,810 |
| 2014 | $5,000 | $73,180 | $37,440 | $35,740 |
| 2013 | $4,926 | $73,360 | $37,530 | $35,830 |
Source: Public Records
Map
Nearby Homes
- 1390 River Oak Dr
- 1401 Knoll Dr
- 1440 Carleton Ave
- 1613 Fairway Ln
- 2001 Lakeview Ct
- 1864 Slippery Rock Rd
- 705 Timber Trail Dr
- 2124 University Dr
- 1385 Ginger Ln
- 1800 Denison Rd
- 605 Hyde Park Ln
- 405 Carriage Hill Rd
- 1919 Coach Dr
- 1925 Coach Dr
- 1803 River Ridge Cir
- 1846 Shetland Rd
- 510 Harlowe Ln Unit 2001C
- 264 E Bailey Rd Unit L
- 1837 Auburn Ave
- 144 E Bailey Rd Unit G
- 1920 Stanford Dr
- 1910 Stanford Dr
- 1921 Seton Hall Dr
- 1917 Seton Hall Dr
- 1904 Stanford Dr
- 1917 Stanford Dr
- 1924 Stanford Dr
- 1925 Seton Hall Dr
- 1921 Stanford Dr
- 1913 Seton Hall Dr
- 1909 Stanford Dr
- 1905 Stanford Dr
- 1913 Stanford Dr
- 1925 Stanford Dr
- 1900 Stanford Dr
- 1928 Stanford Dr
- 1929 Seton Hall Dr
- 1216 Duke Ct
- 1929 Stanford Dr
- 1924 Seton Hall Dr
Your Personal Tour Guide
Ask me questions while you tour the home.