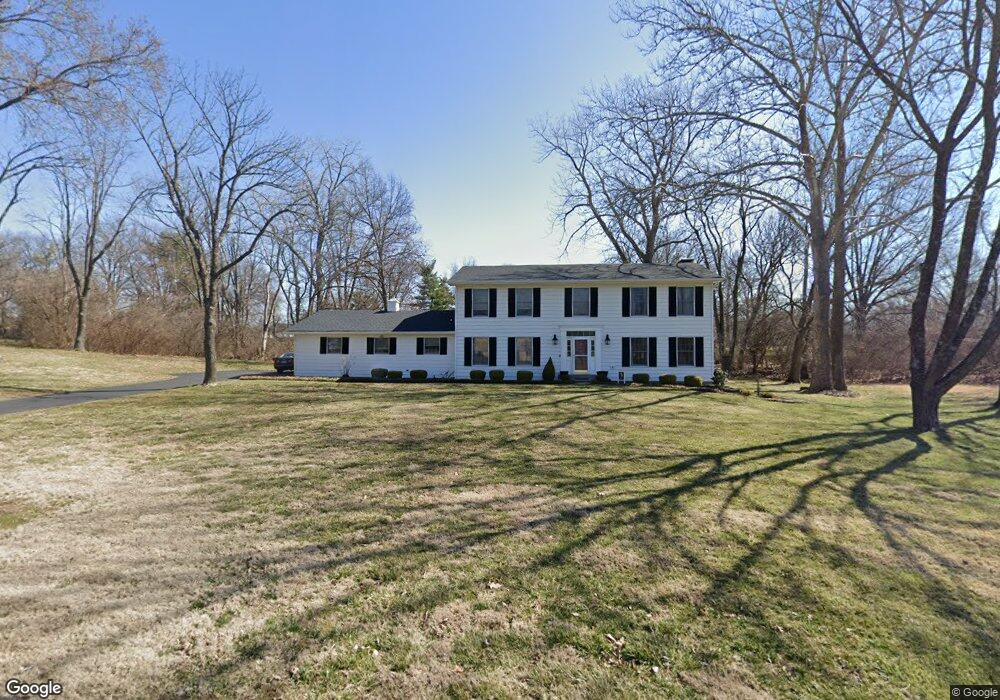
1916 Windmoor Place Saint Louis, MO 63131
Estimated Value: $861,092 - $1,296,000
4
Beds
4
Baths
2,780
Sq Ft
$367/Sq Ft
Est. Value
About This Home
This home is located at 1916 Windmoor Place, Saint Louis, MO 63131 and is currently estimated at $1,021,023, approximately $367 per square foot. 1916 Windmoor Place is a home located in St. Louis County with nearby schools including Westchester Elementary School, North Kirkwood Middle School, and Kirkwood Senior High School.
Ownership History
Date
Name
Owned For
Owner Type
Purchase Details
Closed on
Sep 21, 2017
Sold by
Hellmuth Thomas W and Hellmuth Lynn M
Bought by
Hellmuth Thomas W and Hellmuth Lynn M
Current Estimated Value
Purchase Details
Closed on
Oct 13, 1999
Sold by
Harris Robert S and Harris Dorothy A
Bought by
Hellmuth Thomas W and Hellmuth Lynn M
Home Financials for this Owner
Home Financials are based on the most recent Mortgage that was taken out on this home.
Original Mortgage
$240,000
Outstanding Balance
$69,259
Interest Rate
7.25%
Estimated Equity
$951,764
Purchase Details
Closed on
Oct 1, 1999
Sold by
Morley Harry T and Taylor William
Bought by
Summer Chase Second Addition Home Owners
Home Financials for this Owner
Home Financials are based on the most recent Mortgage that was taken out on this home.
Original Mortgage
$240,000
Outstanding Balance
$69,259
Interest Rate
7.25%
Estimated Equity
$951,764
Create a Home Valuation Report for This Property
The Home Valuation Report is an in-depth analysis detailing your home's value as well as a comparison with similar homes in the area
Home Values in the Area
Average Home Value in this Area
Purchase History
| Date | Buyer | Sale Price | Title Company |
|---|---|---|---|
| Hellmuth Thomas W | -- | None Available | |
| Hellmuth Thomas W | $329,000 | -- | |
| Summer Chase Second Addition Home Owners | -- | -- |
Source: Public Records
Mortgage History
| Date | Status | Borrower | Loan Amount |
|---|---|---|---|
| Open | Hellmuth Thomas W | $240,000 |
Source: Public Records
Tax History Compared to Growth
Tax History
| Year | Tax Paid | Tax Assessment Tax Assessment Total Assessment is a certain percentage of the fair market value that is determined by local assessors to be the total taxable value of land and additions on the property. | Land | Improvement |
|---|---|---|---|---|
| 2025 | $7,644 | $145,810 | $85,790 | $60,020 |
| 2024 | $7,644 | $128,990 | $76,250 | $52,740 |
| 2023 | $7,232 | $128,990 | $76,250 | $52,740 |
| 2022 | $6,931 | $115,220 | $66,710 | $48,510 |
| 2021 | $6,855 | $115,220 | $66,710 | $48,510 |
| 2020 | $6,879 | $111,170 | $57,100 | $54,070 |
| 2019 | $6,965 | $111,170 | $57,100 | $54,070 |
| 2018 | $6,725 | $96,320 | $30,290 | $66,030 |
| 2017 | $6,743 | $96,320 | $30,290 | $66,030 |
| 2016 | $4,482 | $64,850 | $30,290 | $34,560 |
| 2015 | $4,389 | $64,850 | $30,290 | $34,560 |
| 2014 | $3,940 | $56,890 | $26,300 | $30,590 |
Source: Public Records
Map
Nearby Homes
- 12439 Springdale Ln Unit TBB
- The Hawthorne Plan at Ballas Ridge
- The Roclare II Plan at Ballas Ridge
- The Westchester IV Plan at Ballas Ridge
- The Nottingham II Plan at Ballas Ridge
- The Hawthorne II Plan at Ballas Ridge
- TBB
- TBB Ballas Ridge Roclare II
- TBB Ballas Ridge Westchester IV
- TBB Ballas Ridge Hawthorne II
- TBB
- 2056 N Ballas Rd
- 2062 N Ballas Rd
- 0 Unknown Unit 22071090
- 12841 Thornhill Ct
- 1515 Topping Rd
- 1824 Topping Rd
- 8 Briarbrook Trail
- 2409 N Ballas Rd
- 918 N Ballas Rd
- 12493 Drexel Hill Dr
- 1924 Windmoor Place
- 1908 Windmoor Place
- 12520 Ridgemoor Lake Ct
- 12494 Drexel Hill Dr
- 1909 Windmoor Place
- 1925 Windmoor Place
- 1812 Springdale Acres Ln
- 1933 Drexel Hill Ct
- 12488 Drexel Hill Dr
- 12477 Drexel Hill Dr
- 1922 Drexel Hill Ct
- 12528 Ridgemoor Lake Ct
- 1912 Ridgemoor Lake Ct
- 1816 Springdale Acres Ln
- 12527 Ridgemoor Lake Ct
- 12476 Drexel Hill Dr
- 1906 Ridgemoor Lake Ct
- 1934 Drexel Hill Ct
- 1933 Windmoor Place