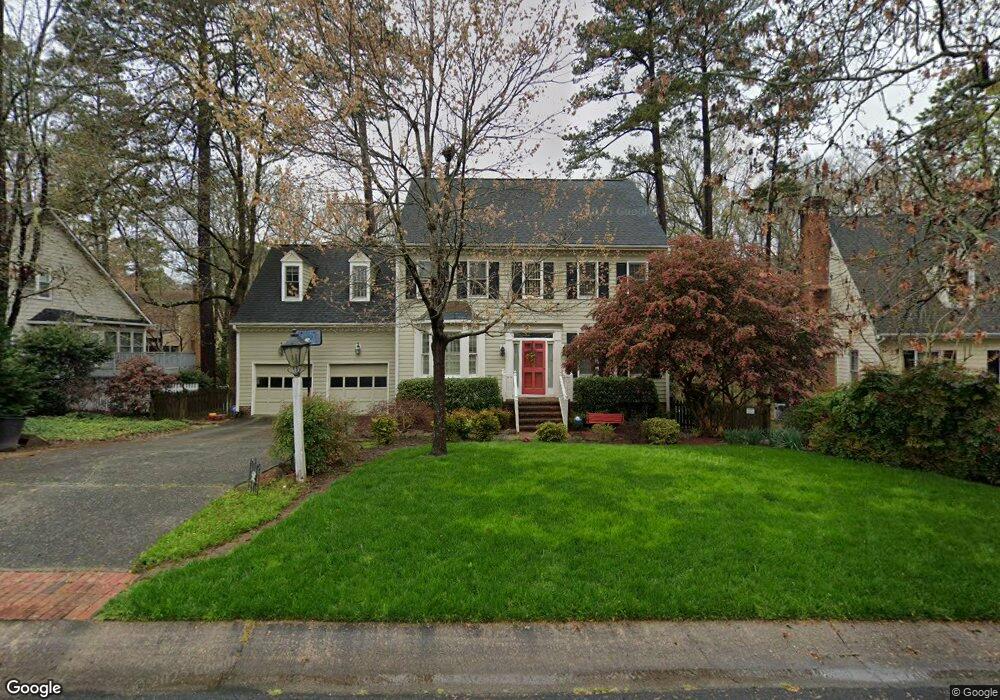
1917 Bearkling Place Chapel Hill, NC 27517
Estimated Value: $637,000 - $645,000
4
Beds
3
Baths
2,586
Sq Ft
$248/Sq Ft
Est. Value
About This Home
This home is located at 1917 Bearkling Place, Chapel Hill, NC 27517 and is currently estimated at $641,328, approximately $248 per square foot. 1917 Bearkling Place is a home located in Durham County with nearby schools including Creekside Elementary School, Morehead Montessori, and Sherwood Githens Middle.
Ownership History
Date
Name
Owned For
Owner Type
Purchase Details
Closed on
Feb 18, 2013
Sold by
Sharpe Linda B
Bought by
Pate Virginia W and Deal Allison M
Current Estimated Value
Home Financials for this Owner
Home Financials are based on the most recent Mortgage that was taken out on this home.
Original Mortgage
$294,400
Outstanding Balance
$205,992
Interest Rate
3.43%
Mortgage Type
New Conventional
Estimated Equity
$435,336
Purchase Details
Closed on
Jul 26, 2011
Sold by
Teer Dorothy F
Bought by
Sharpe Linda B
Purchase Details
Closed on
Sep 7, 2006
Sold by
Decroix Gregory A and Stoltman Decroix Susan G
Bought by
Teer Dorothy F
Home Financials for this Owner
Home Financials are based on the most recent Mortgage that was taken out on this home.
Original Mortgage
$286,732
Interest Rate
6.87%
Mortgage Type
Purchase Money Mortgage
Purchase Details
Closed on
Sep 29, 1998
Sold by
Moriarty Moriarty John L
Bought by
Decroix Gregory A and Stoltman Decroix Susan G
Create a Home Valuation Report for This Property
The Home Valuation Report is an in-depth analysis detailing your home's value as well as a comparison with similar homes in the area
Home Values in the Area
Average Home Value in this Area
Purchase History
| Date | Buyer | Sale Price | Title Company |
|---|---|---|---|
| Pate Virginia W | $368,000 | None Available | |
| Sharpe Linda B | $374,000 | None Available | |
| Teer Dorothy F | $358,500 | Bb&T | |
| Decroix Gregory A | $238,000 | -- |
Source: Public Records
Mortgage History
| Date | Status | Borrower | Loan Amount |
|---|---|---|---|
| Open | Pate Virginia W | $294,400 | |
| Previous Owner | Teer Dorothy F | $286,732 |
Source: Public Records
Tax History Compared to Growth
Tax History
| Year | Tax Paid | Tax Assessment Tax Assessment Total Assessment is a certain percentage of the fair market value that is determined by local assessors to be the total taxable value of land and additions on the property. | Land | Improvement |
|---|---|---|---|---|
| 2025 | $6,200 | $625,402 | $165,000 | $460,402 |
| 2024 | $5,080 | $364,157 | $72,000 | $292,157 |
| 2023 | $4,770 | $364,157 | $72,000 | $292,157 |
| 2022 | $4,661 | $364,157 | $72,000 | $292,157 |
| 2021 | $4,639 | $364,157 | $72,000 | $292,157 |
| 2020 | $4,530 | $364,157 | $72,000 | $292,157 |
| 2019 | $4,530 | $364,157 | $72,000 | $292,157 |
| 2018 | $4,658 | $343,366 | $69,000 | $274,366 |
| 2017 | $4,623 | $343,366 | $69,000 | $274,366 |
| 2016 | $4,400 | $338,202 | $69,000 | $269,202 |
| 2015 | $4,728 | $341,546 | $63,731 | $277,815 |
| 2014 | -- | $341,546 | $63,731 | $277,815 |
Source: Public Records
Map
Nearby Homes
- 1233 Cranebridge Place
- 1219 Cranebridge Place
- 1002 Kingswood Dr Unit H
- 1010 Kingswood Dr Unit G
- 47 Abernathy Dr Unit 13
- 108 Littlejohn Rd Unit B
- 245 N Crest Dr
- 6724 Glen Forrest Dr
- 3 Peaceful Place
- 165 Springberry Ln Unit 165
- 167 Springberry Ln Unit 167
- 380 Summerwalk Cir Unit 380
- 249 Summerwalk Cir
- 2204 Ridgefield Dr
- 1 Vauxhall Place
- 2 Vauxhall Place Unit 48
- 6507 Glen Forrest Dr
- 143 Manordale Dr
- 309 Crossland Dr
- 142 Celeste Cir
- 1915 Bearkling Place
- 1919 Bearkling Place
- 8 Benwick Ct
- 1924 Bearkling Place
- 6 Benwick Ct
- 1913 Bearkling Place
- 1926 Bearkling Place
- 1921 Bearkling Place
- 1918 Bearkling Place
- 7 Benwick Ct
- 4 Benwick Ct
- 1911 Bearkling Place
- 1928 Bearkling Place
- 1923 Bearkling Place
- 1243 Falmouth Ct
- 1242 Falmouth Ct
- 5 Benwick Ct
- 1916 Bearkling Place
- 2 Benwick Ct
- 1929 Bearkling Place